Customer churn is a critical challenge for telecommunications companies, as acquiring new customers is significantly more expensive than retaining existing ones. This analysis focuses on understanding churn behavior, identifying high-risk customer segments, and supporting data-driven retention strategies.
The project integrates business problem framing, data exploration, Power BI–based visualization, and machine learning techniques to uncover churn patterns and proactively identify customers at risk of leaving..
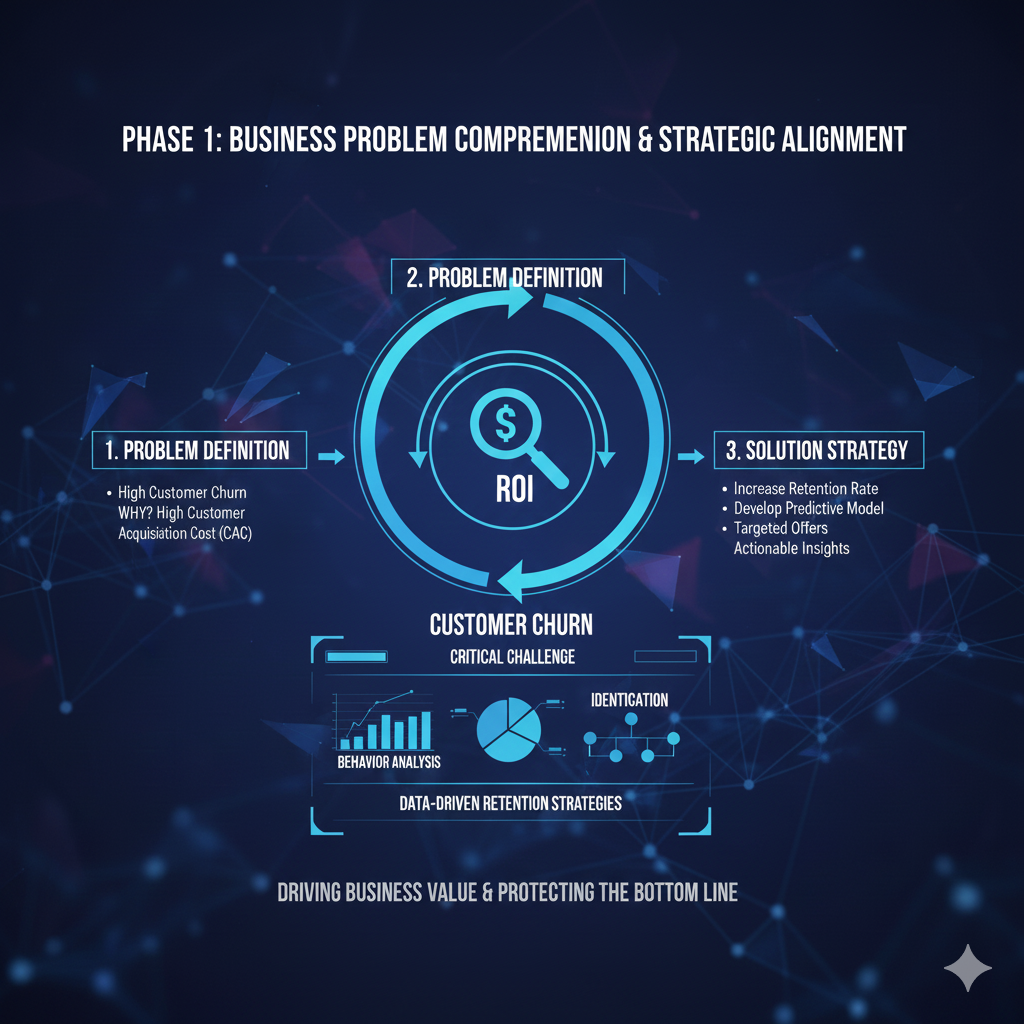
Step 1 : Business Understanding
The first and most critical step in this project was developing a clear understanding of the business problem. Before applying any analytical or modeling techniques, I focused on identifying the goals, objectives, and constraints that would shape the entire solution.
To achieve this, I began by asking a set of fundamental questions:
1. What problem am I trying to solve? The core business challenge in this project is customer churn. Understanding why customers are leaving and identifying opportunities to reduce churn.
2. Why is this problem important to solve? Customer churn has a direct impact on revenue, growth, and long-term business sustainability. Retaining existing customers is often more cost-effective than acquiring new ones, making churn reduction a high-priority business concern.
3. What are the business initiatives and expectations? The primary business initiative in this case is to increase customer retention.
Step 2: Data Understanding & Preparation
After clearly defining the business problem, the next step was to develop a deep understanding of the data. This phase focused on exploring the dataset, understanding each variable in the context of the business domain, and assessing data quality to ensure it was suitable for analysis.
Understanding the Data & Variables Using domain knowledge, I examined each variable to understand its meaning, relevance, and potential impact on customer churn. This helped identify which features were more likely to influence churn behavior and guided later feature selection and modeling decisions.
Tool Selection & Approach Based on the nature of the dataset and the business objective, I selected Power BI as the primary tool for efficient data exploration, cleaning, and visualization. Power BI enabled rapid insights through interactive dashboards and helped uncover trends, patterns, and anomalies in the data.
Data preparation and Exploration
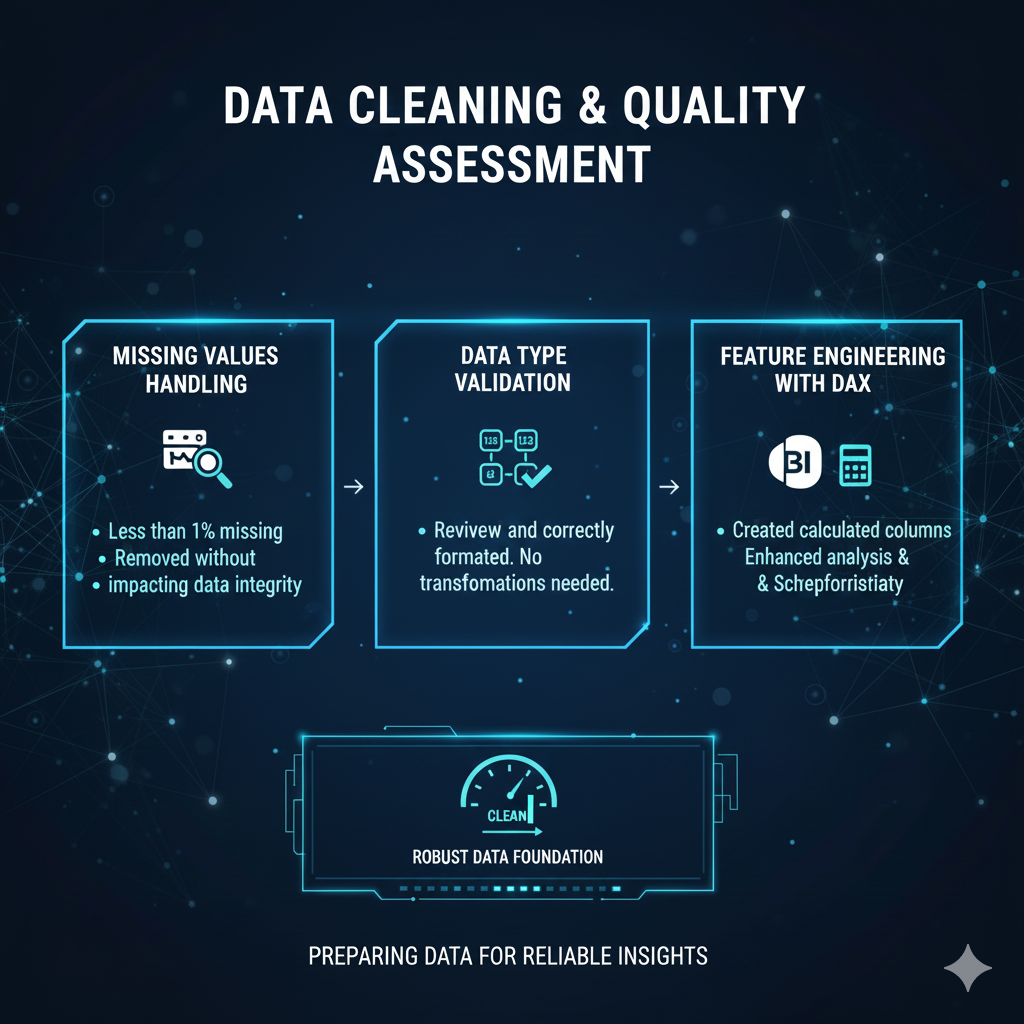
Data Cleaning & Quality Assessment
The dataset contained less than 1% missing values, which were removed without impacting the overall integrity of the data.
Data types were reviewed and found to be correctly formatted, requiring no additional transformations.
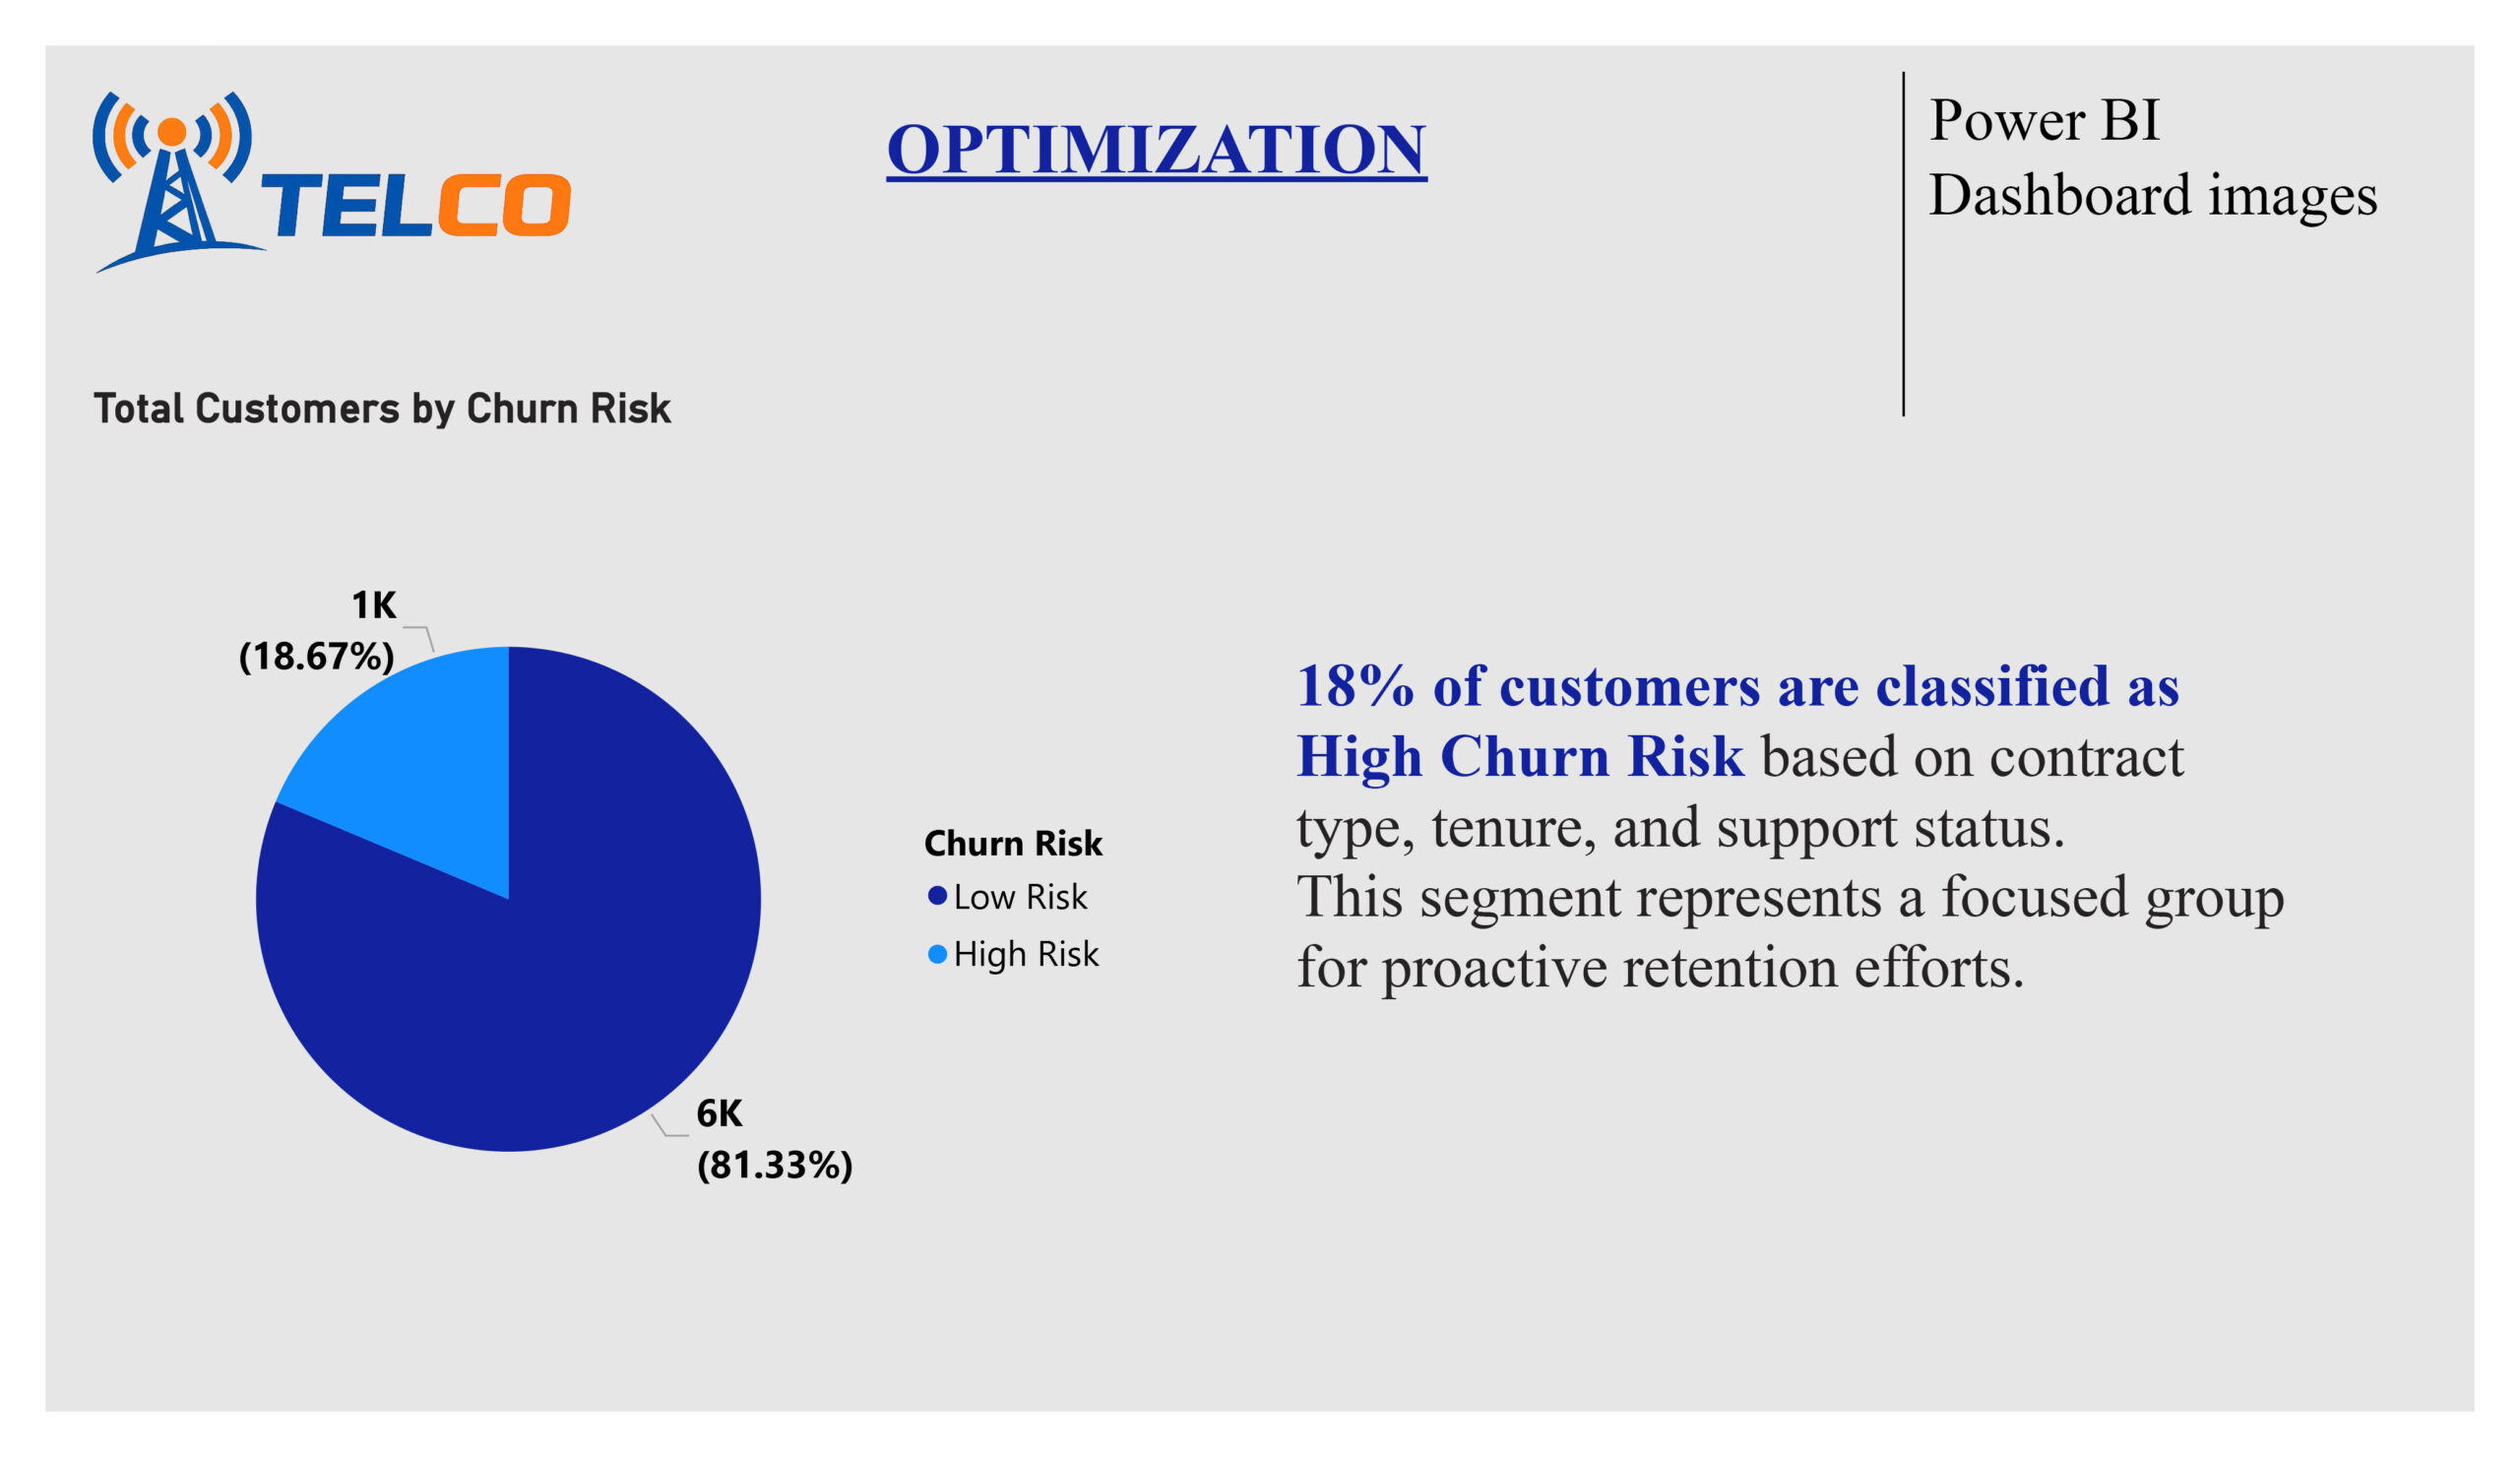
DAX was used to create calculated columns and measures to enhance analysis and improve data interpretability. examples 1. Total Customers 2. Churn Rate 3. Active and Churned Customers 4. Monthly Charge Band. 5. Churn Risk
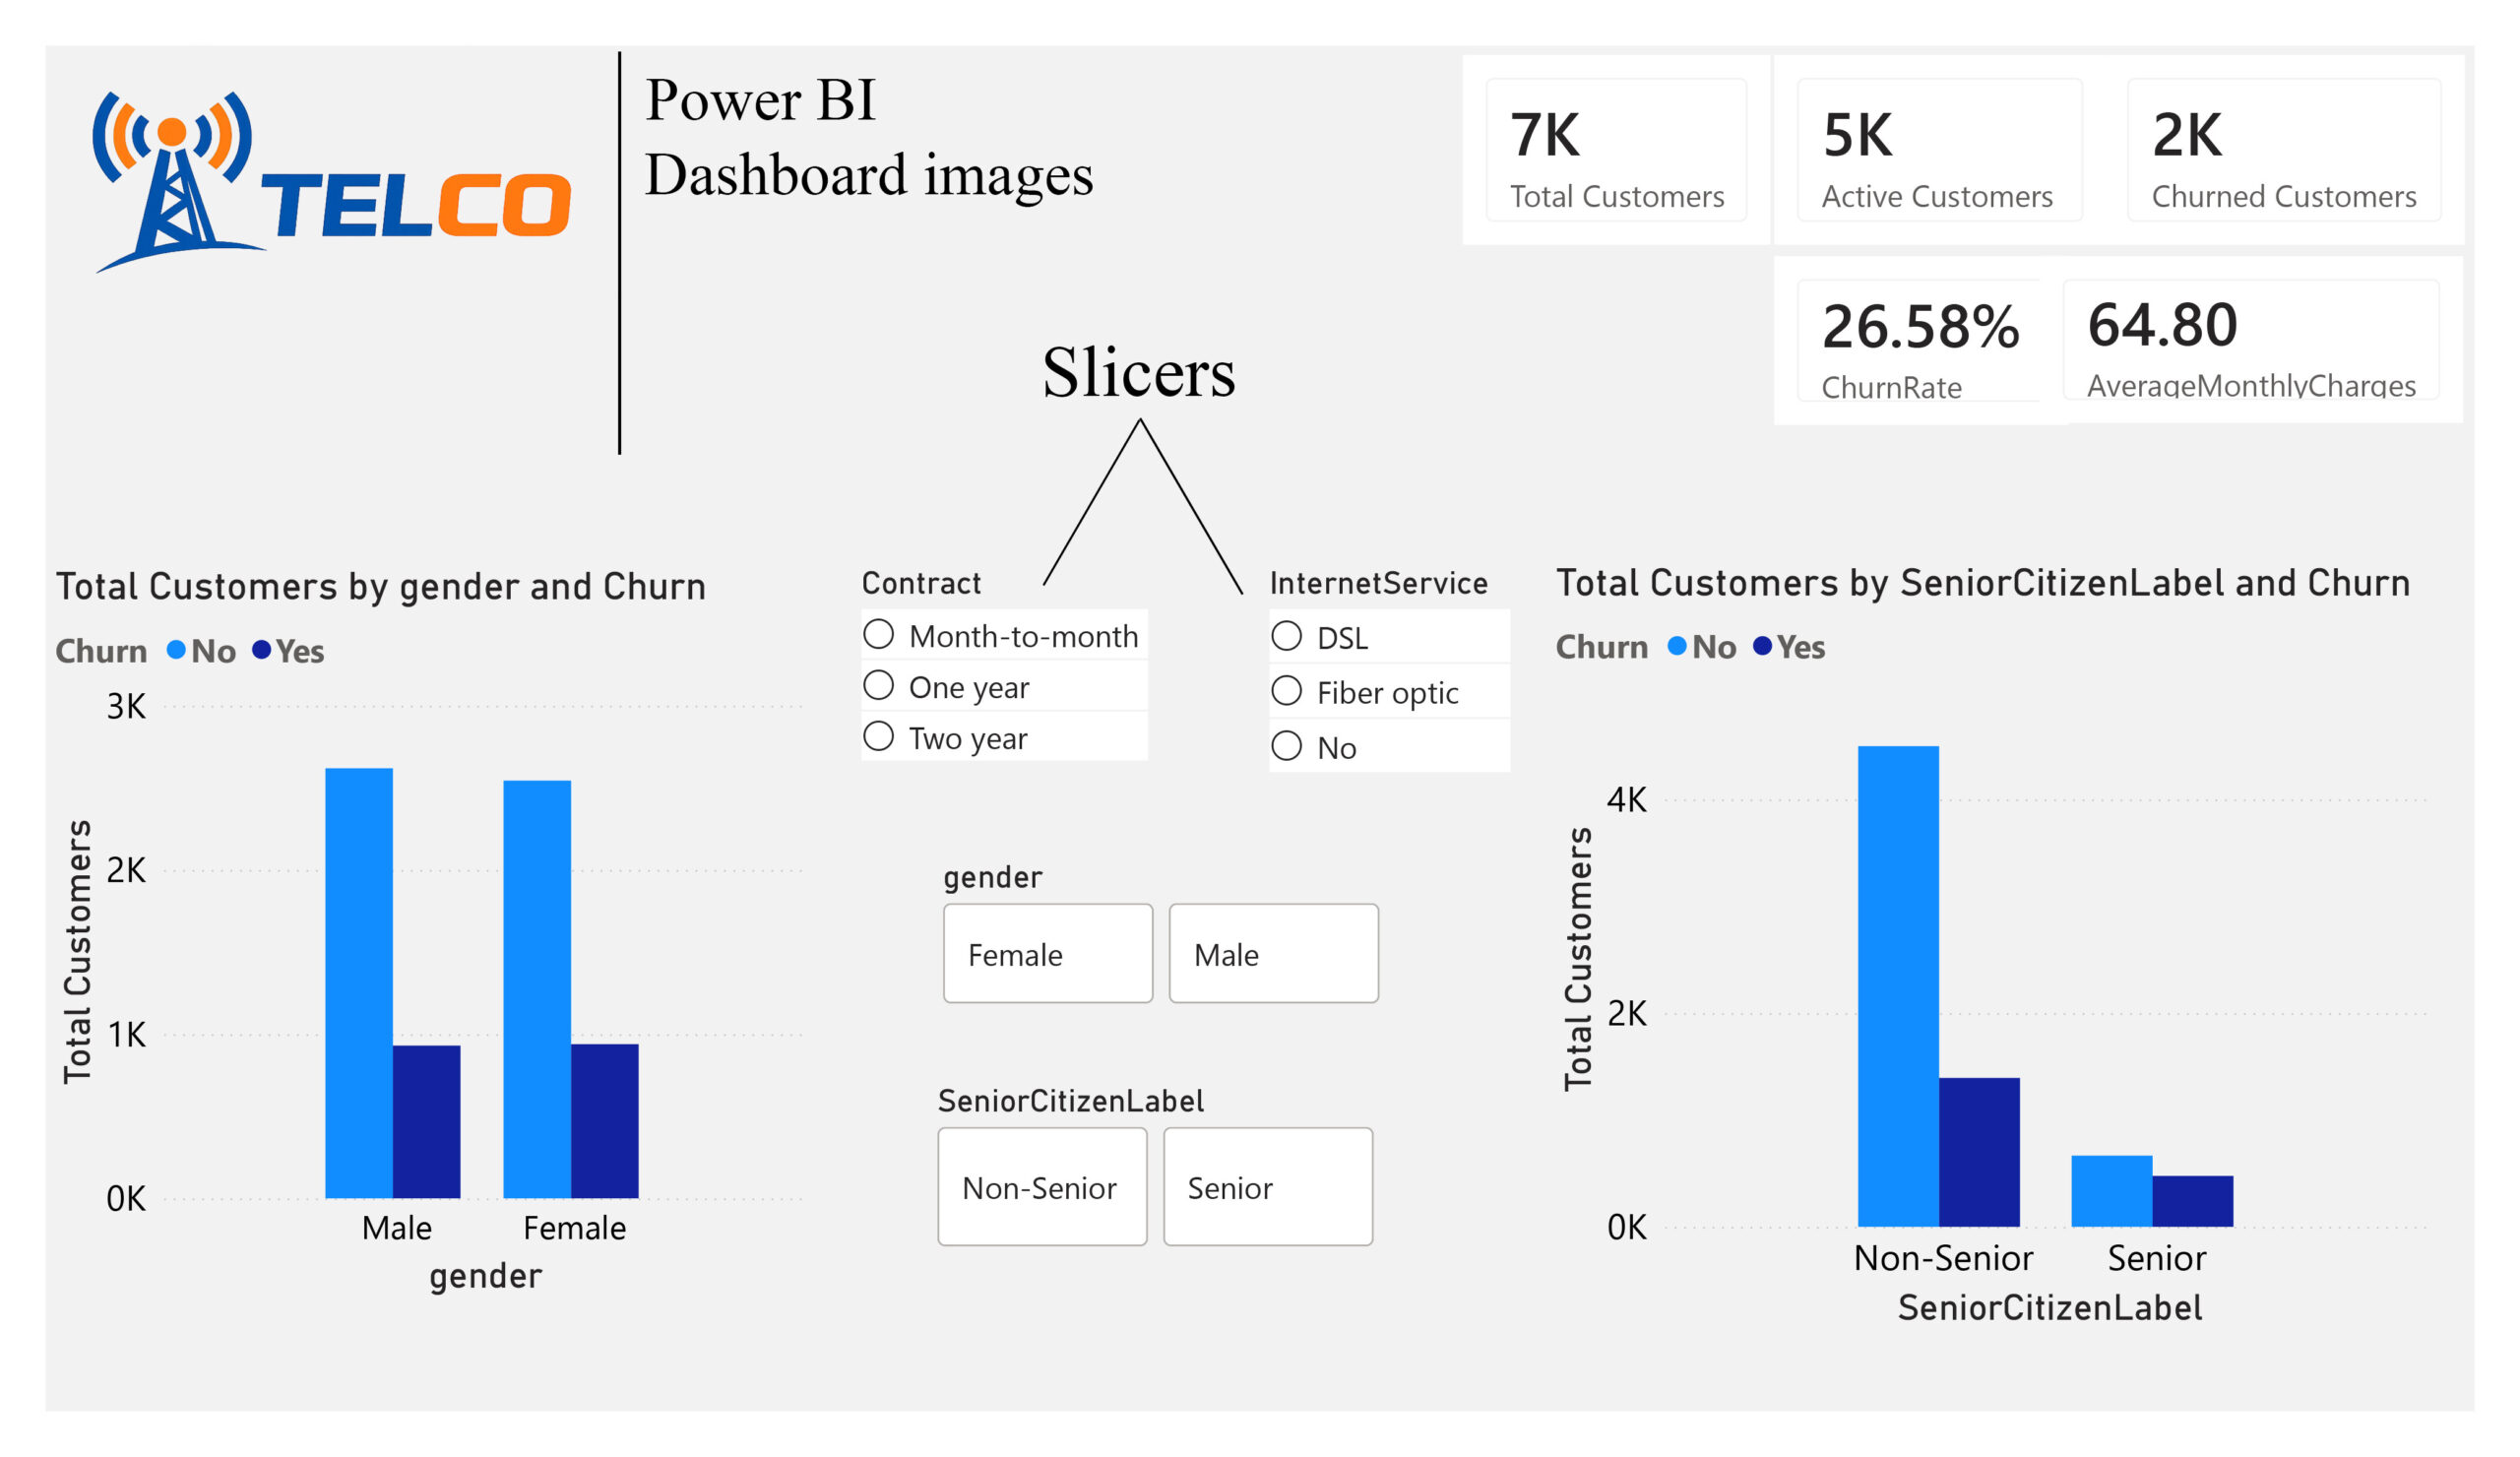
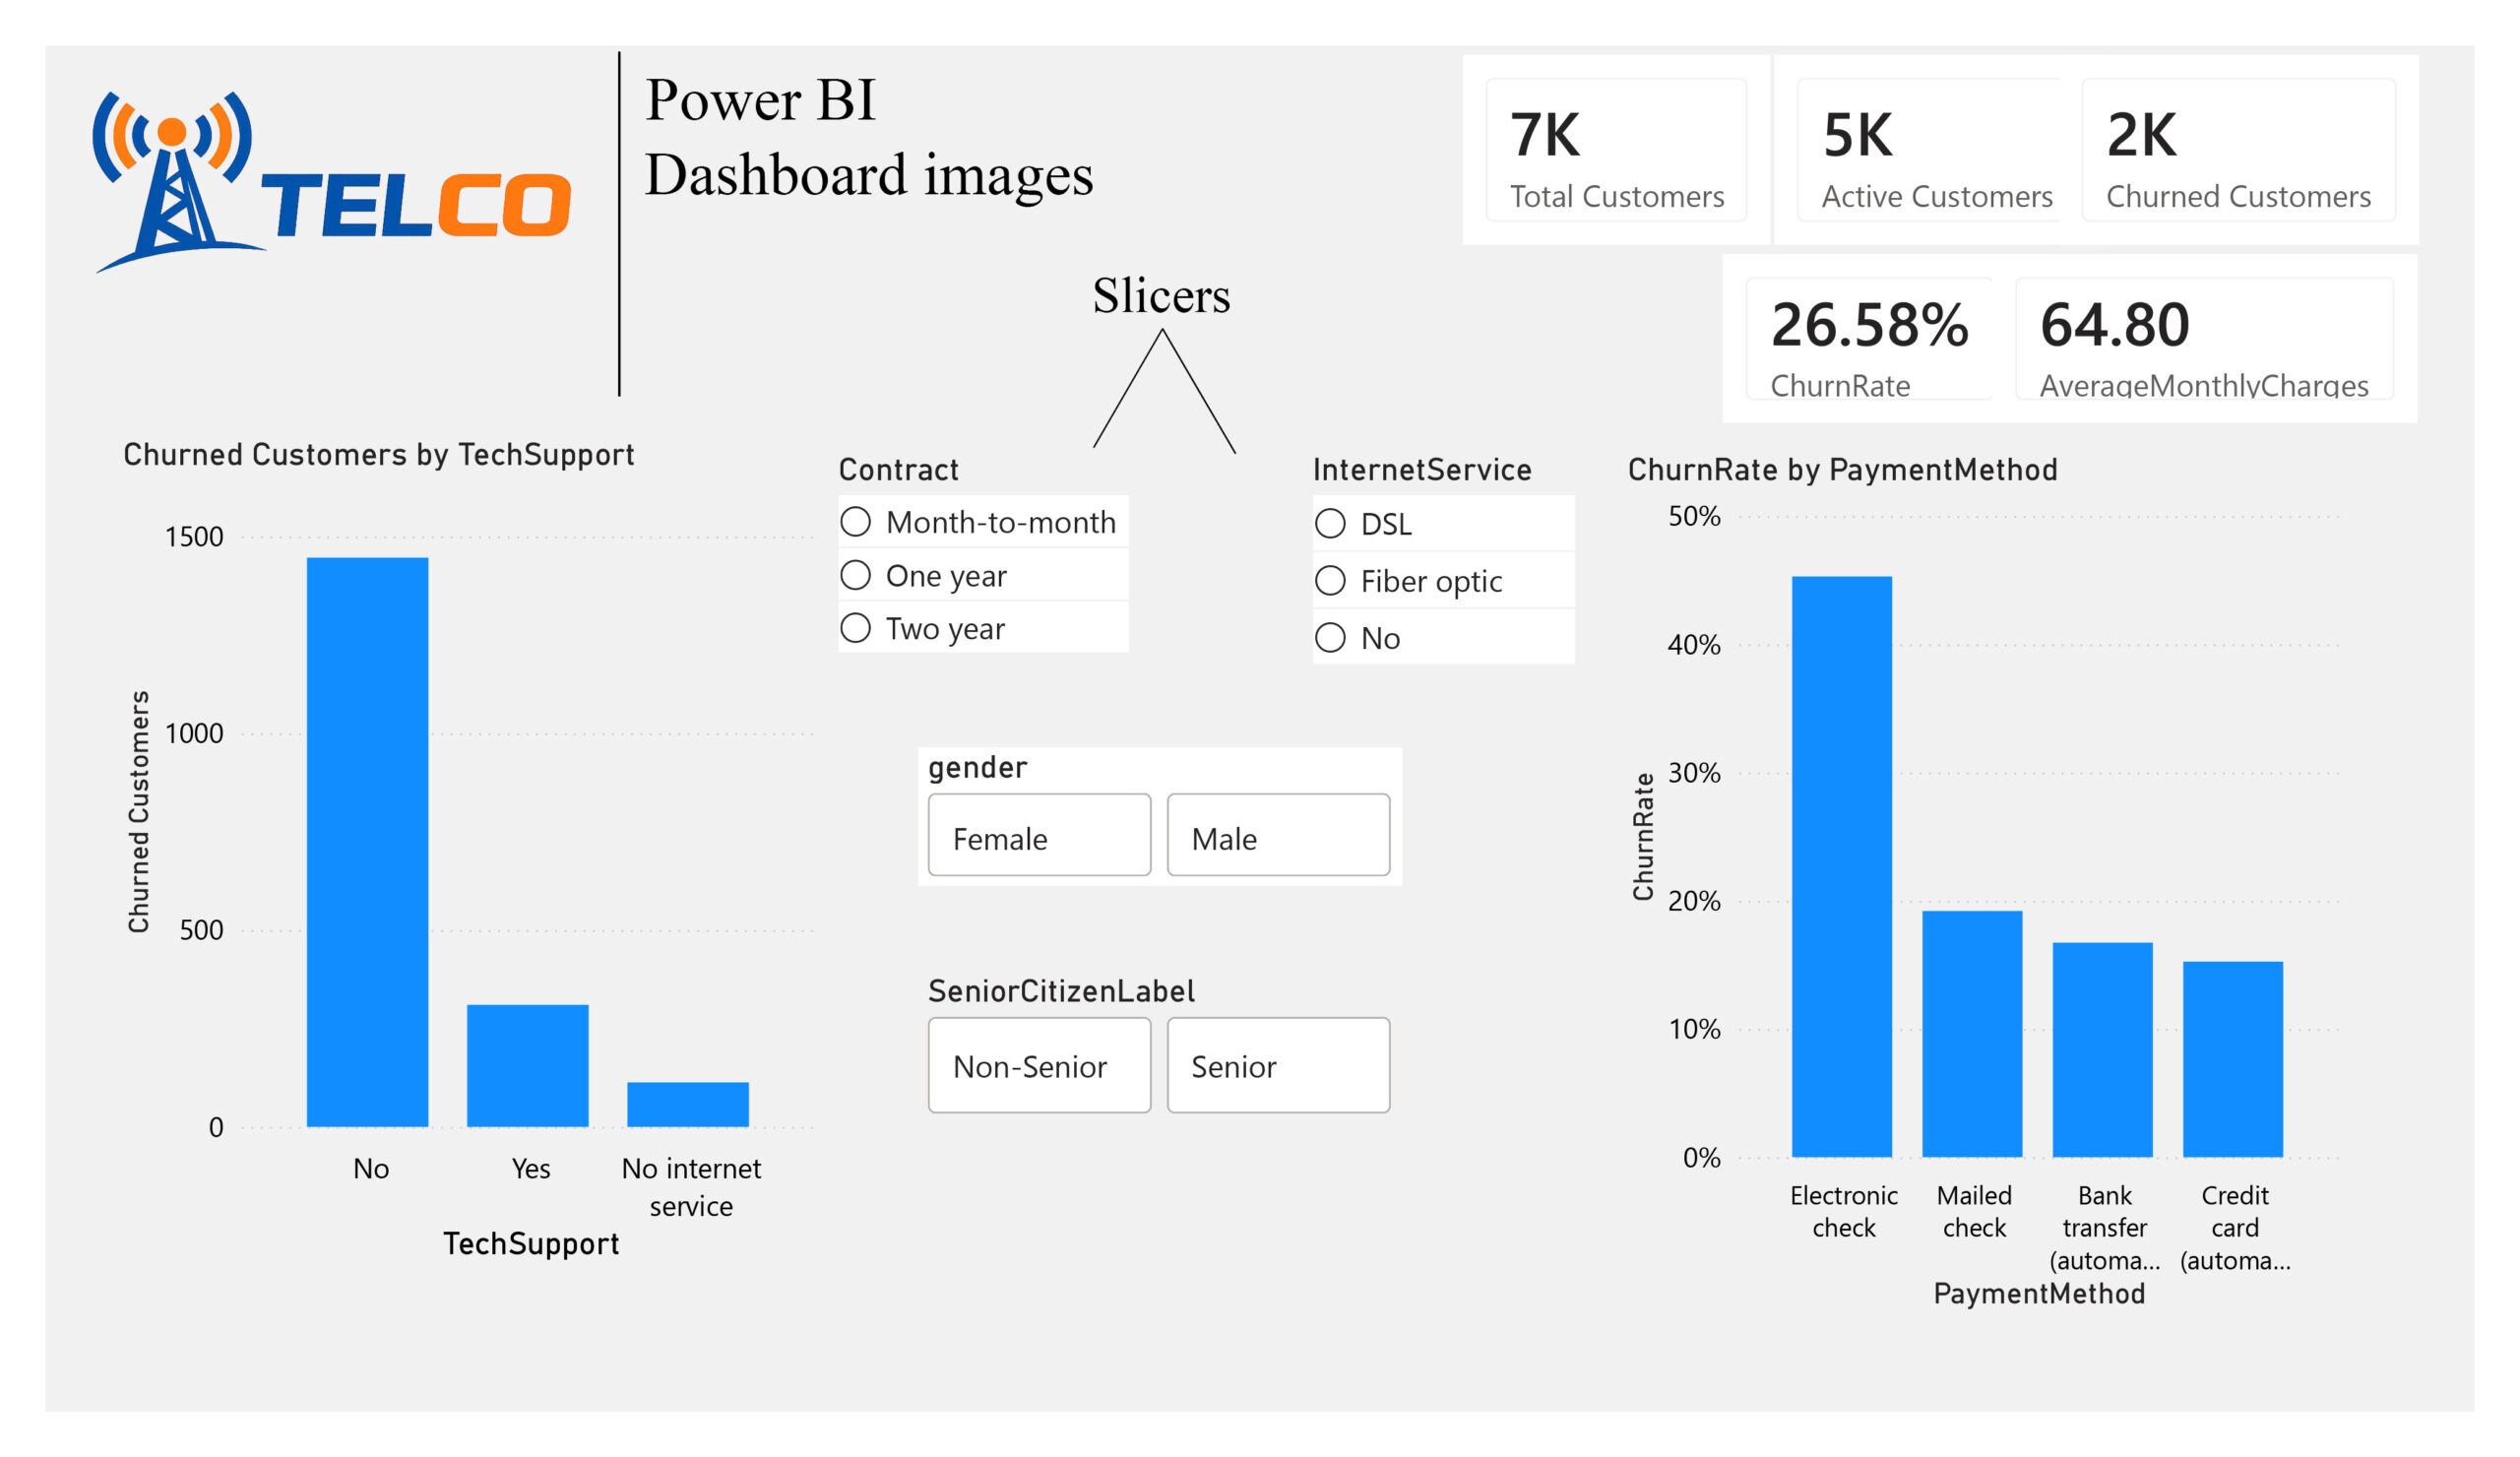
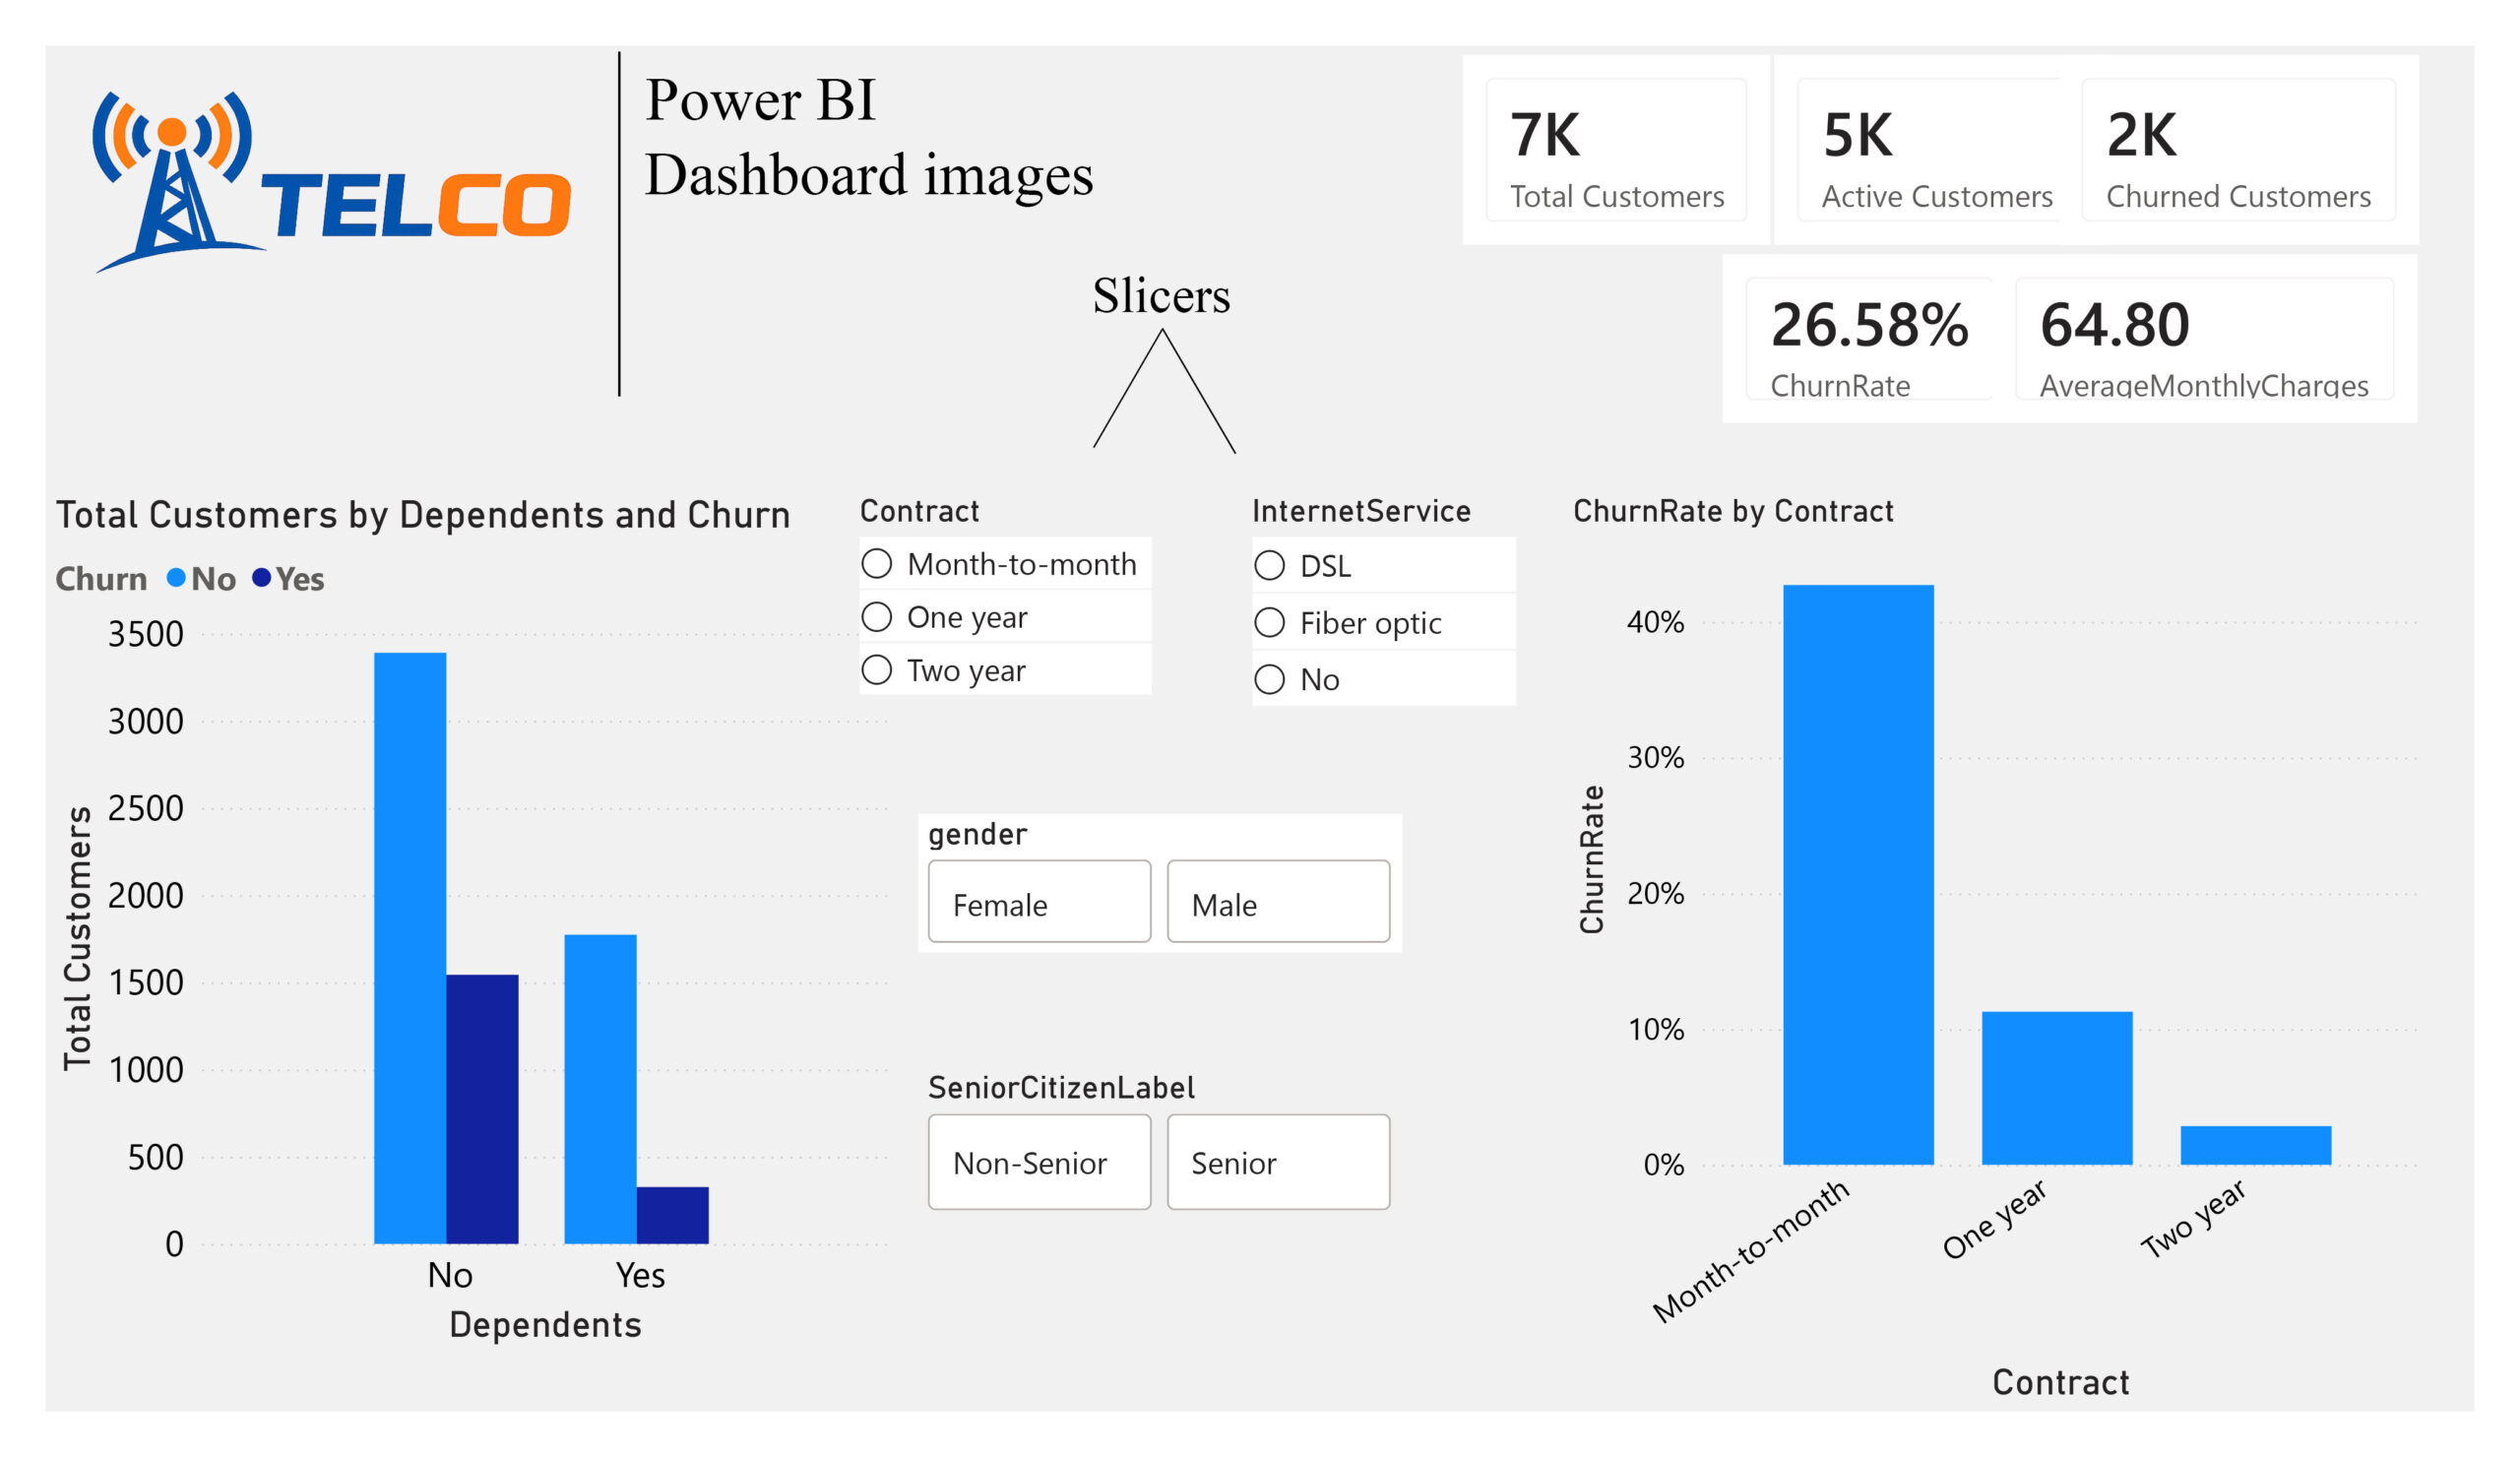
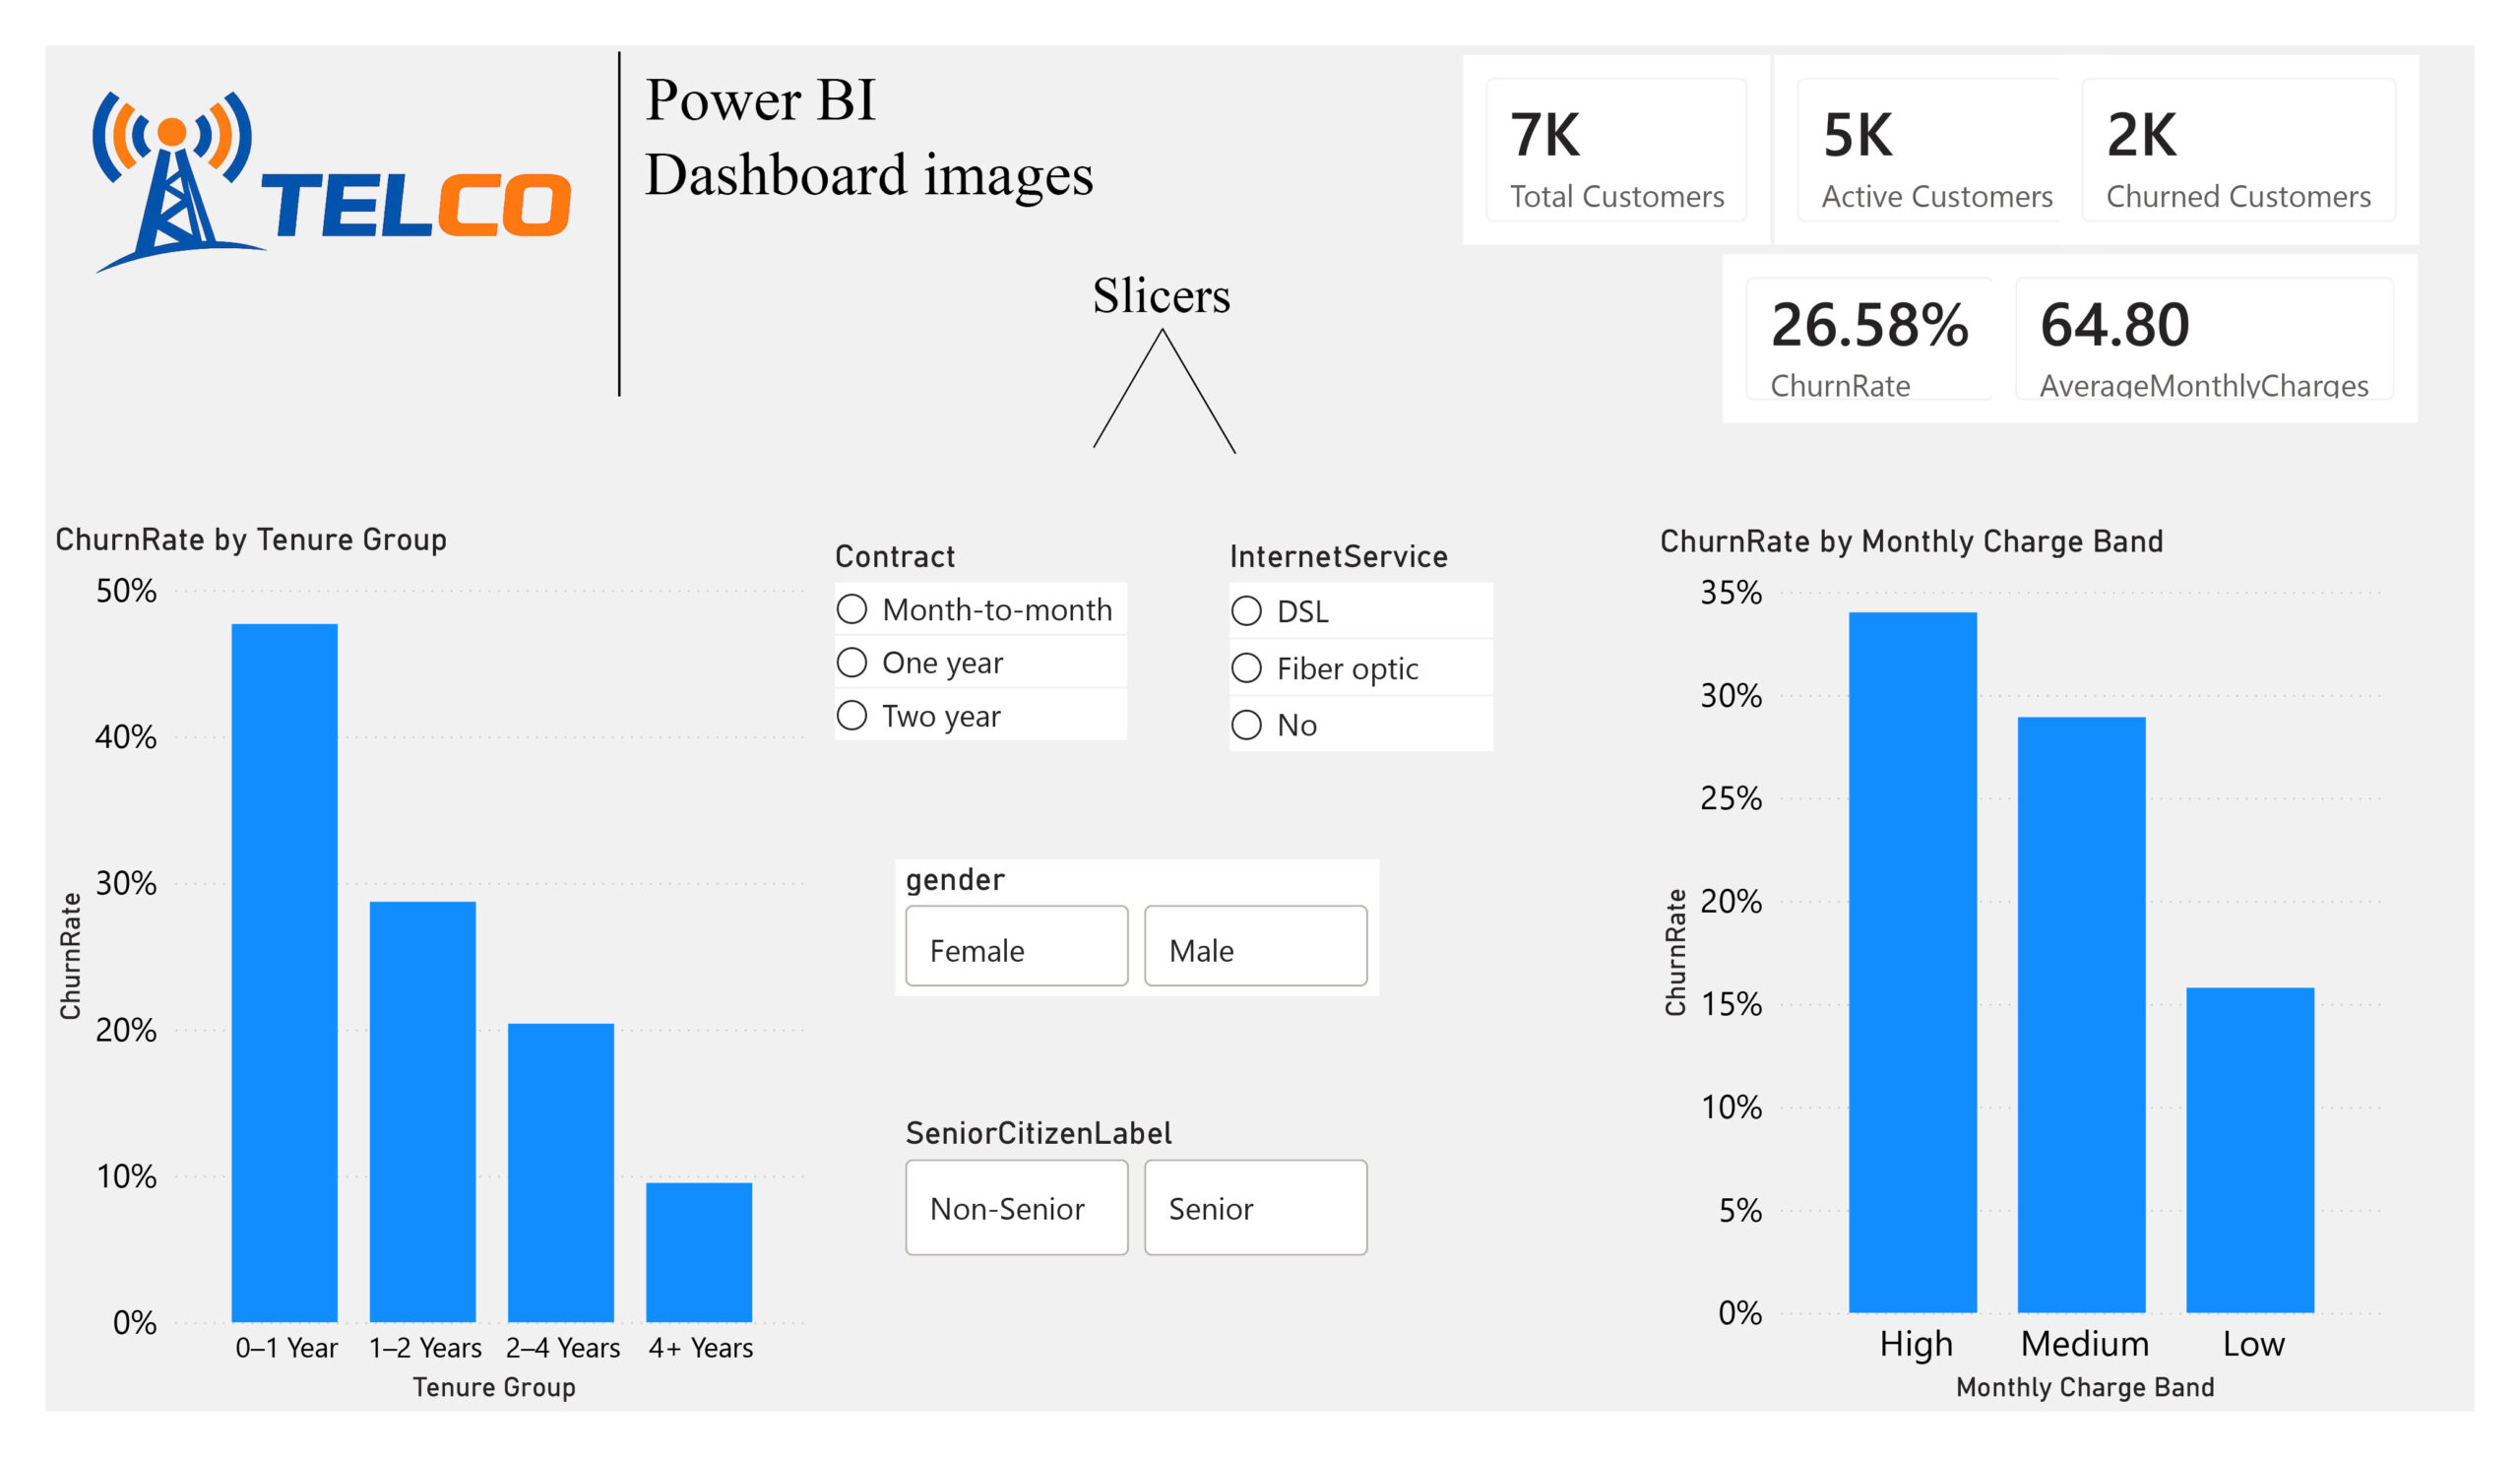
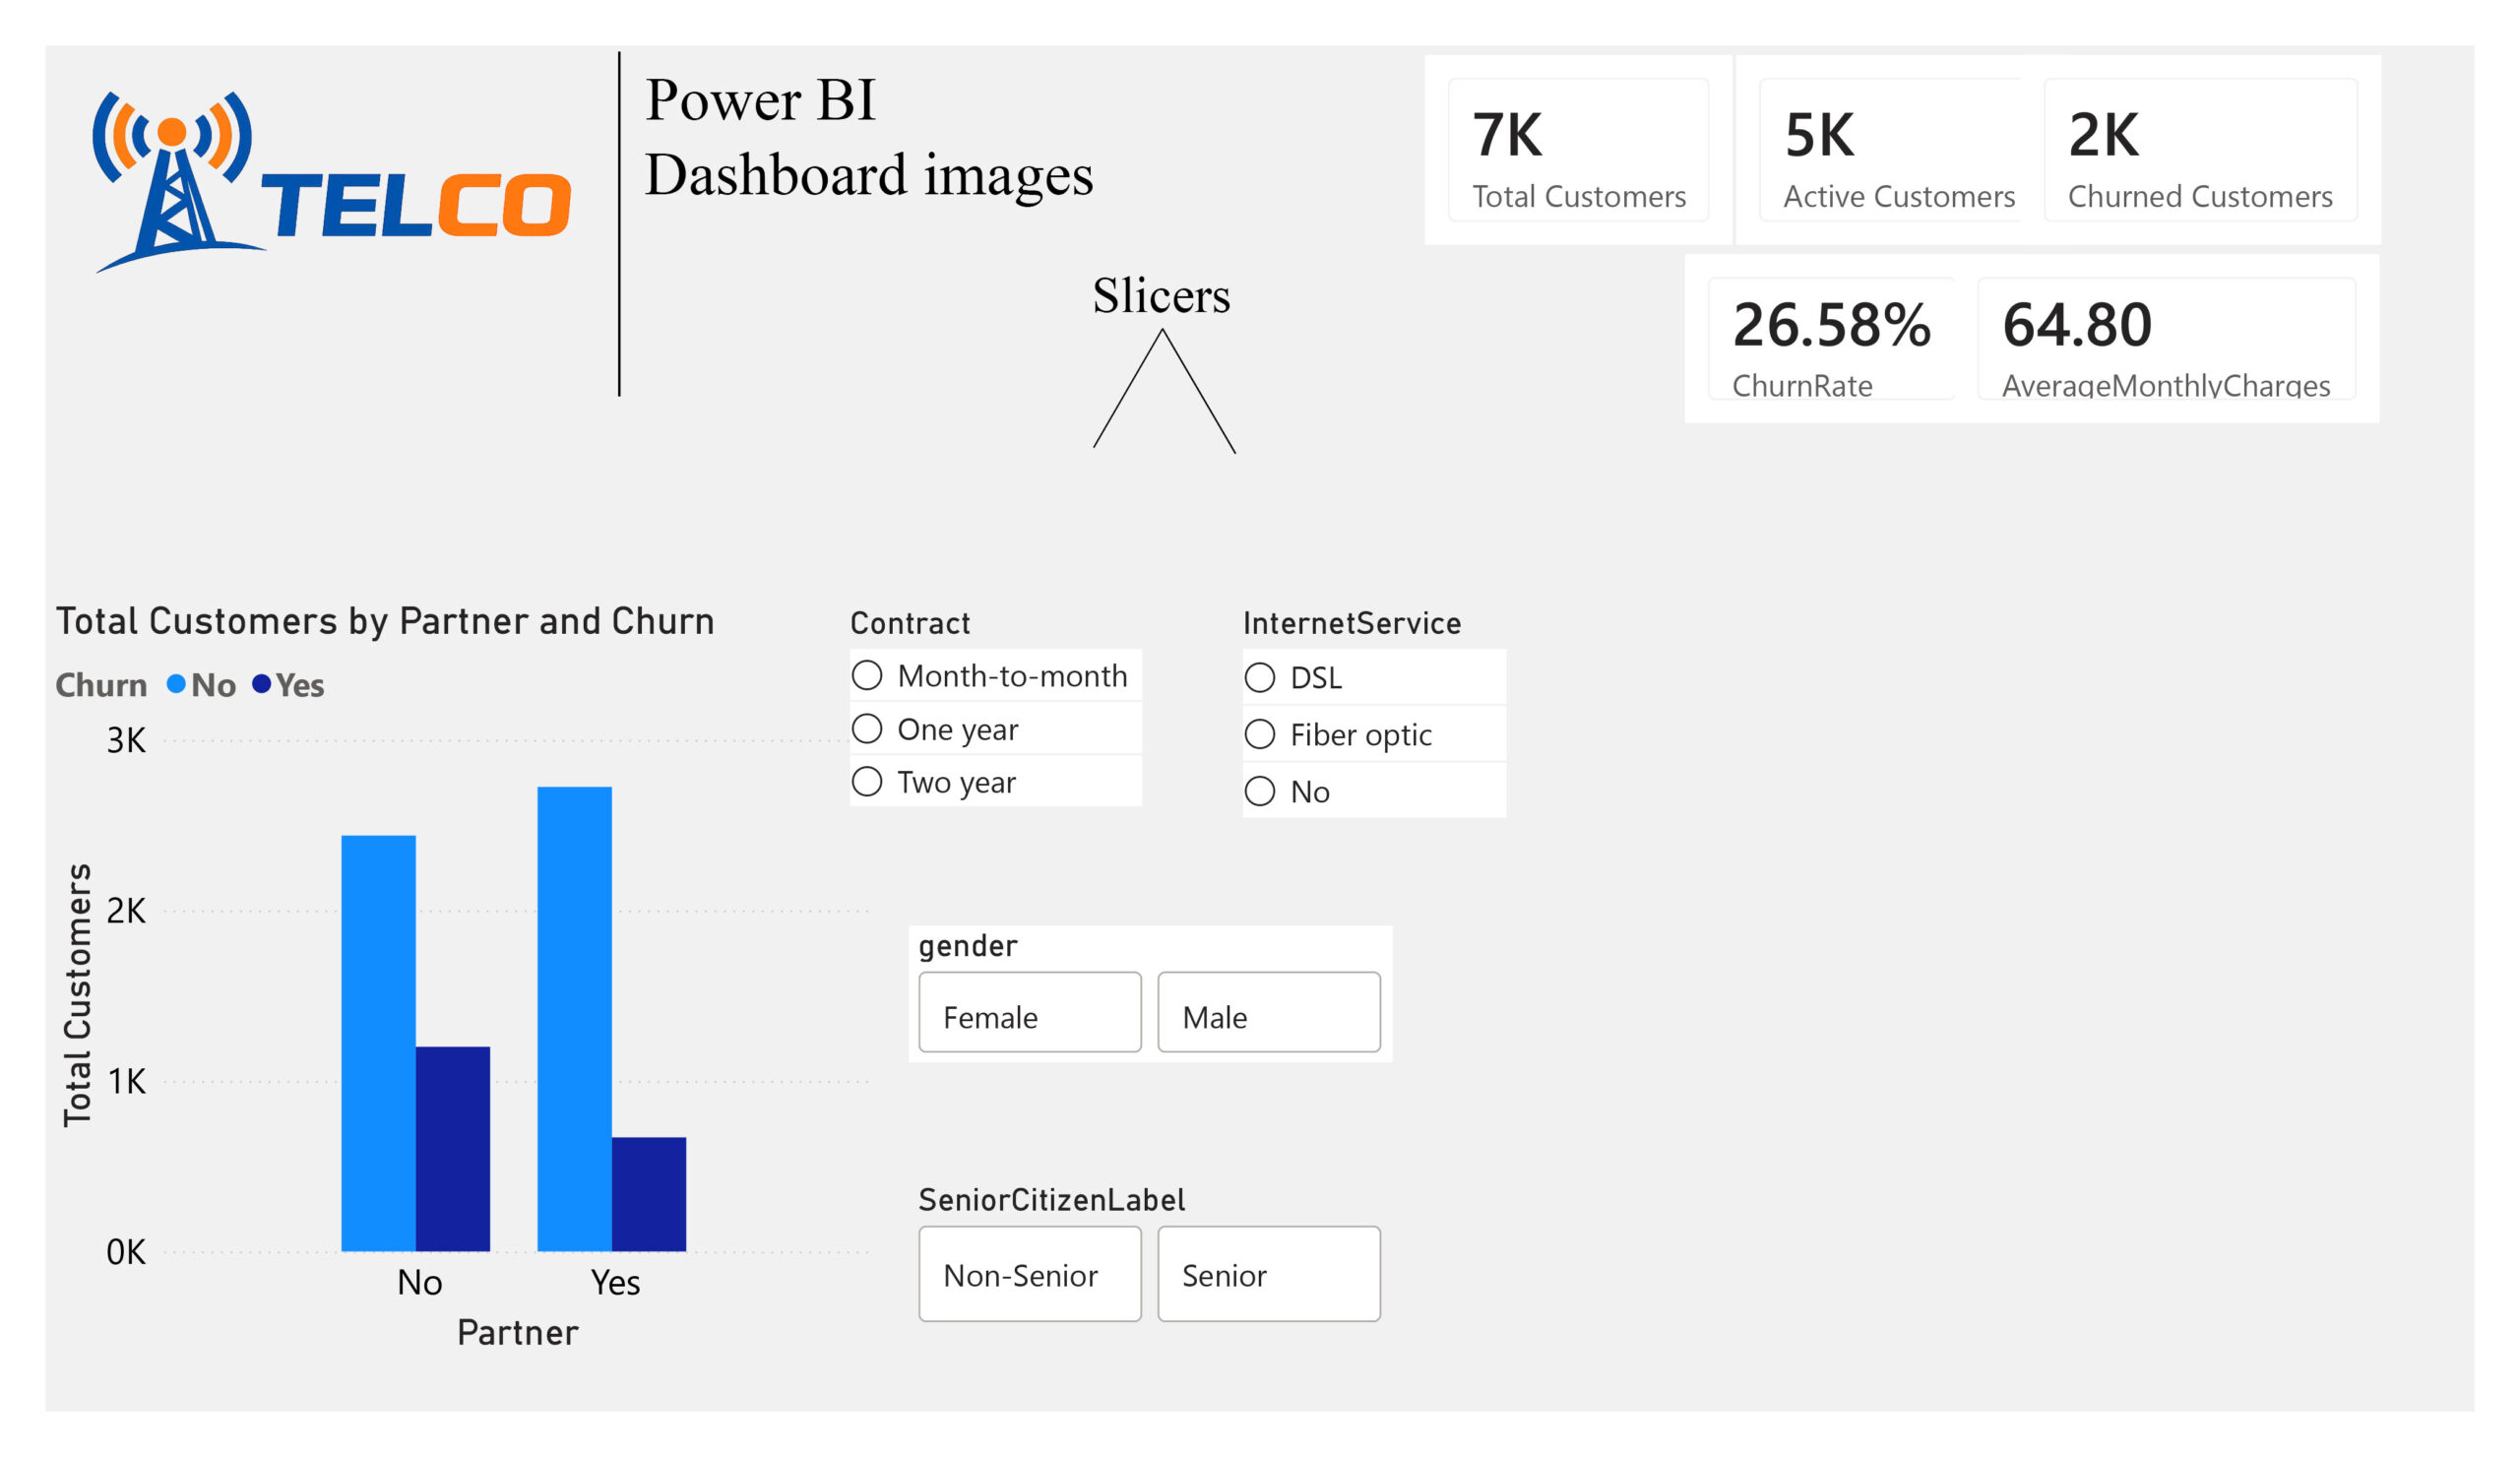
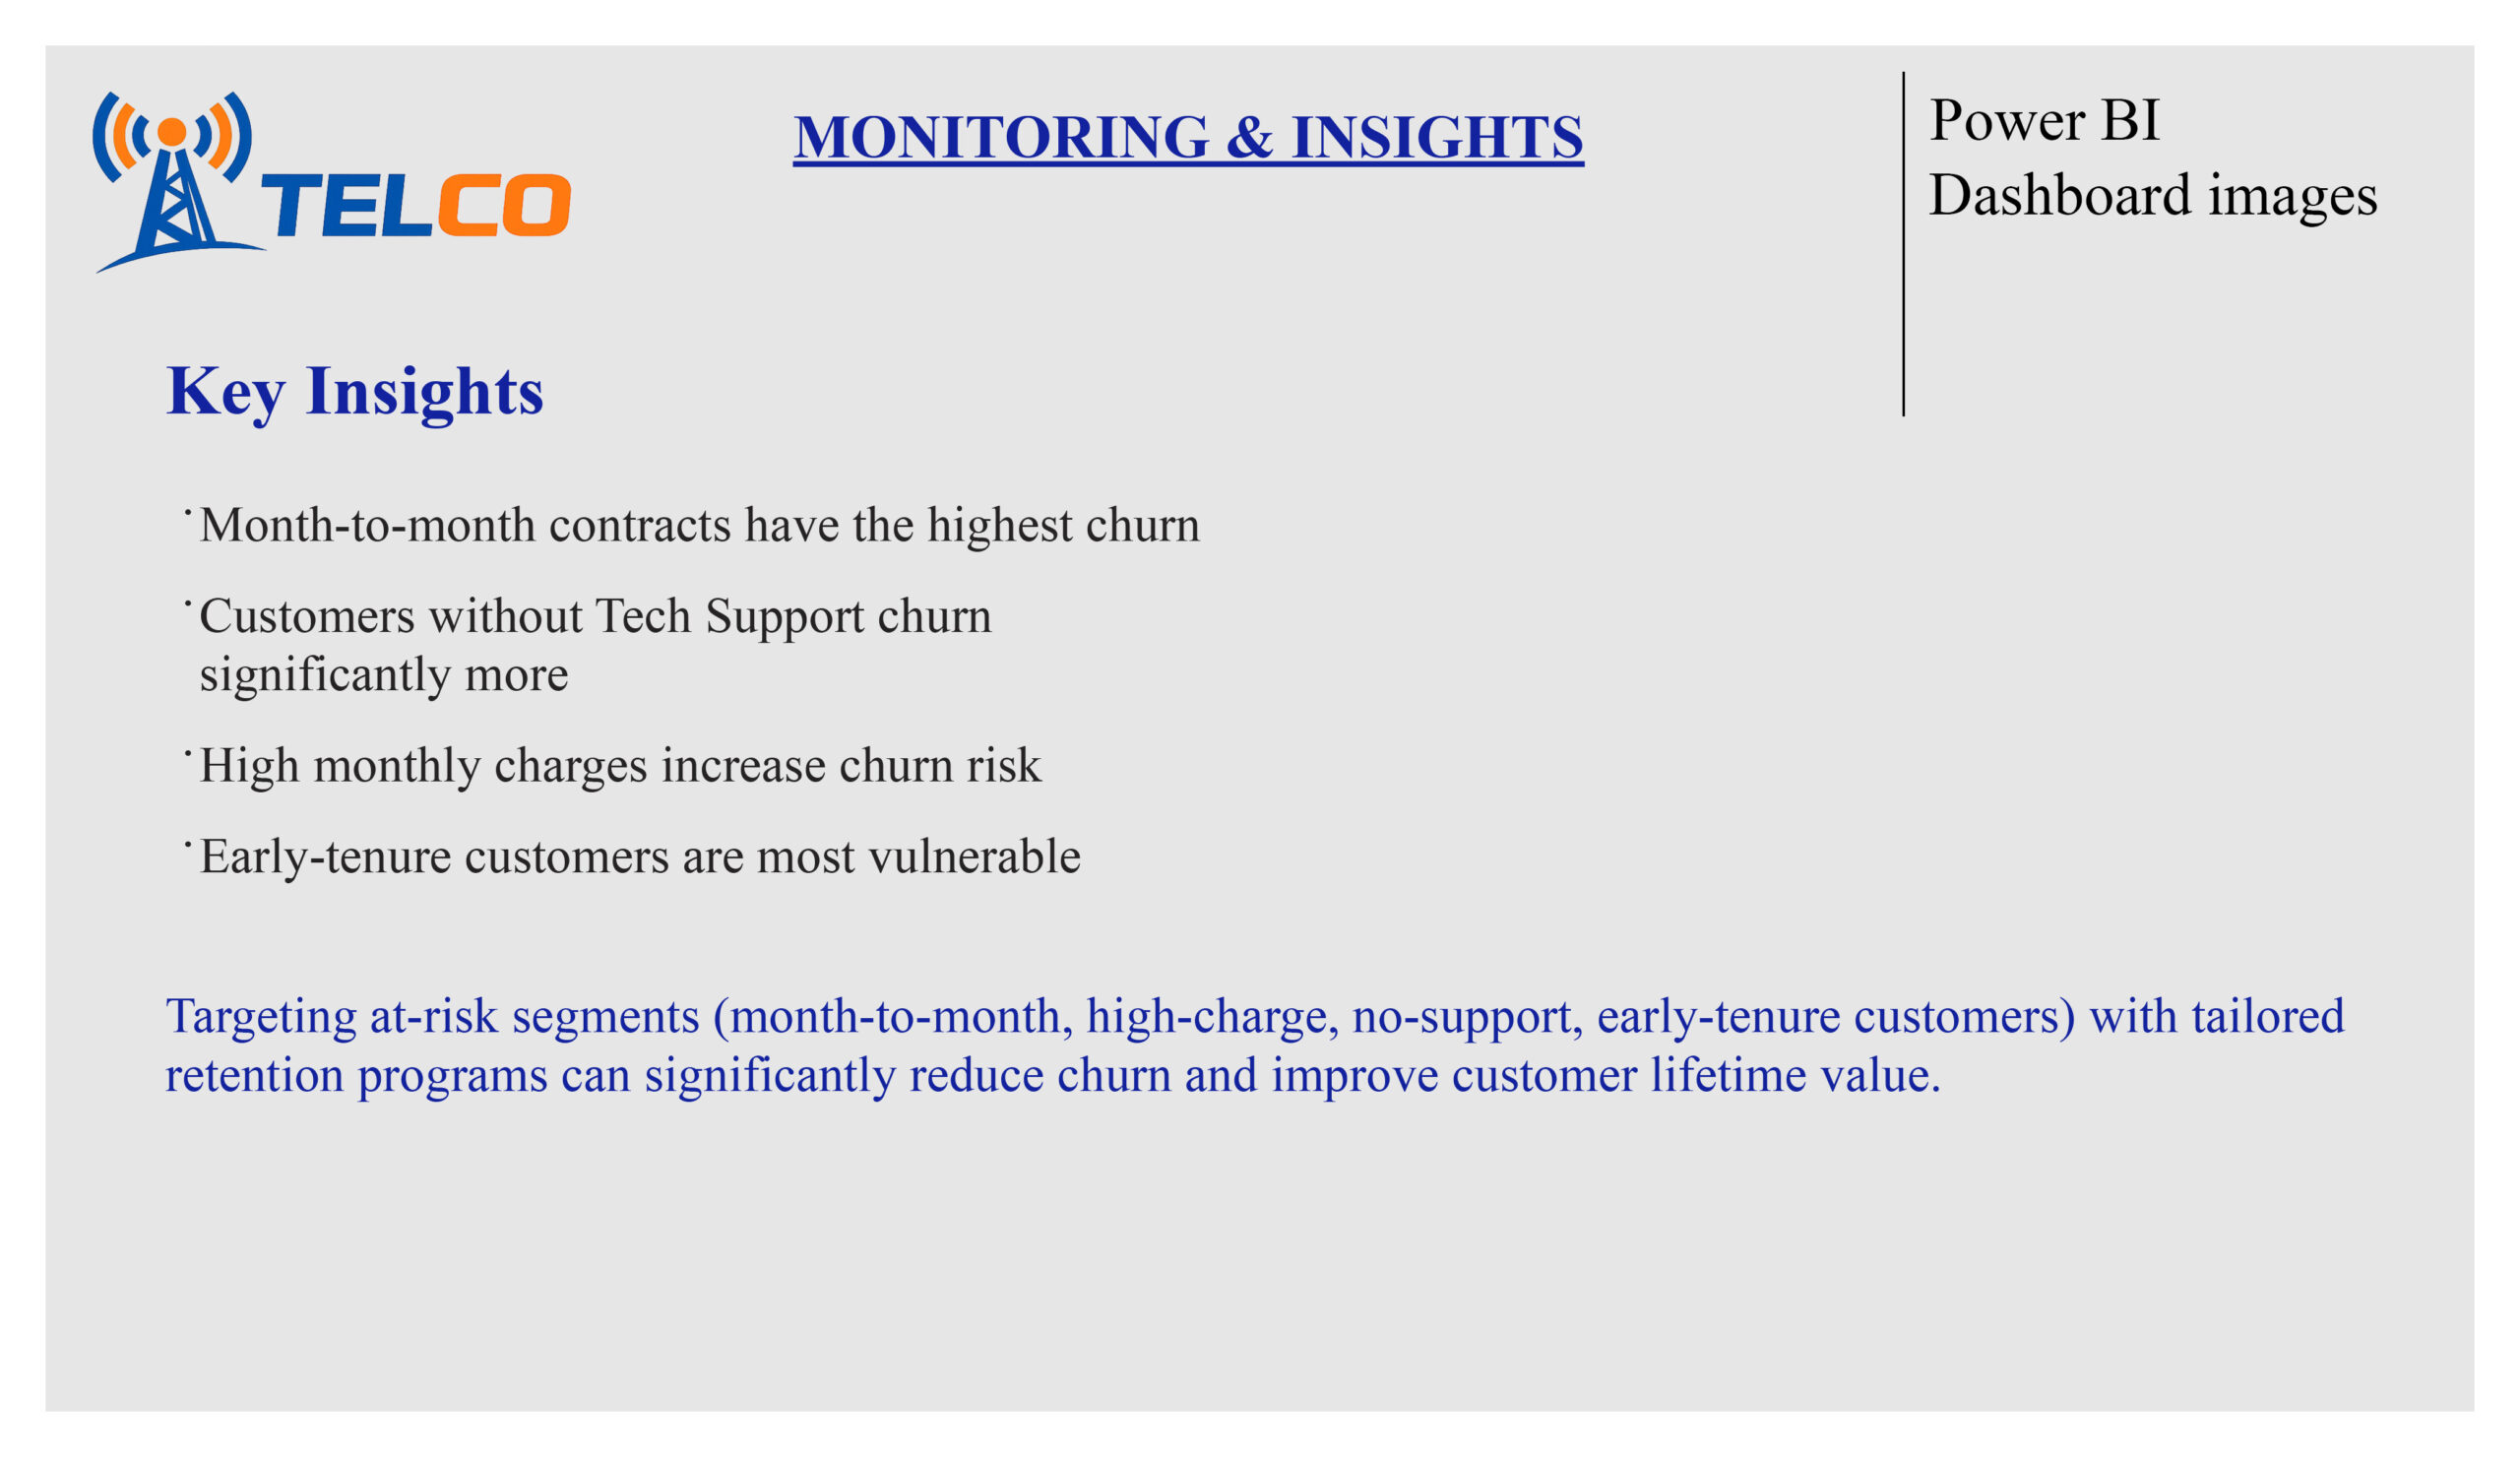
NB / The screenshots below highlights the interactive Power BI dashboards used to understand patterns and identify key variables and generate actionable insights.
To enhance data exploration and usability, Power BI slicers were incorporated into the dashboard. Slicers allowed dynamic filtering of the data across key dimensions.
From the charts, it was clear that customers without technical support and those in the higher monthly charge bands had noticeably higher churn rates. The visualization made it easy to compare churn across different customer groups, clearly highlighting which segments were most at risk.
NB/ This kind of analysis provides business stakeholders with a clear understanding of the current state of the business, enabling them to make targeted, informed, data-driven decisions based on insights
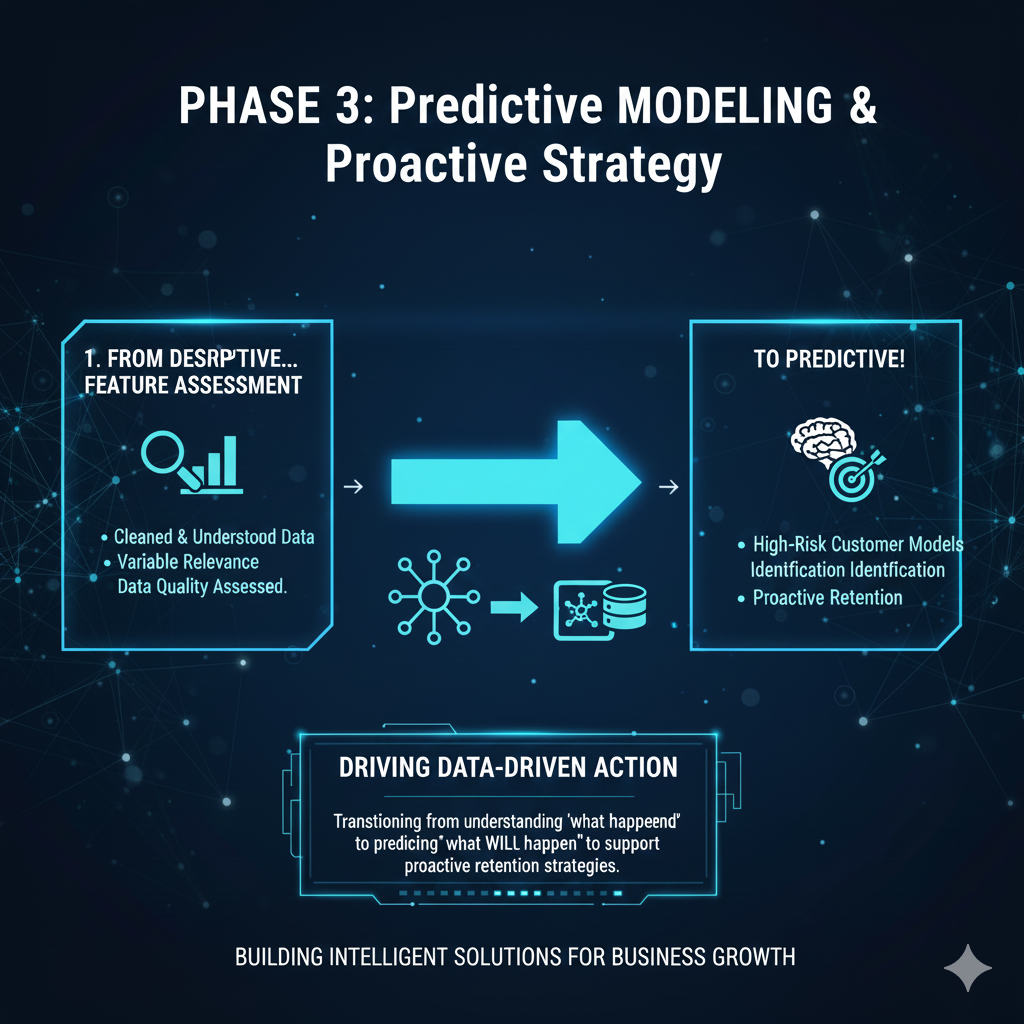
Step 3: Transition from Data Exploration to Predictive Modeling
With a clear understanding of the data structure, variable relevance, and overall data quality, the analysis progressed beyond descriptive exploration. The cleaned and well-understood dataset provided a strong foundation for machine learning modeling, enabling the development of predictive solutions aimed at identifying customers at high risk of churn. This transition marked the shift from understanding what has happened to predicting what is likely to happen, supporting proactive and data-driven retention strategies.