My objective was to predict the probability of customer churn by leveraging demographic, contractual, service, and billing features. This allows for the identification of high-risk customer segments and supports data-driven retention strategies that maximize business impact.
Data Source
As shown earlier, the data was first explored and validated in Power BI, where data cleaning, understanding, exploratory data analysis (EDA), and initial feature engineering were performed. Following this groundwork, the refined dataset was exported for advanced analytics and machine learning modeling.
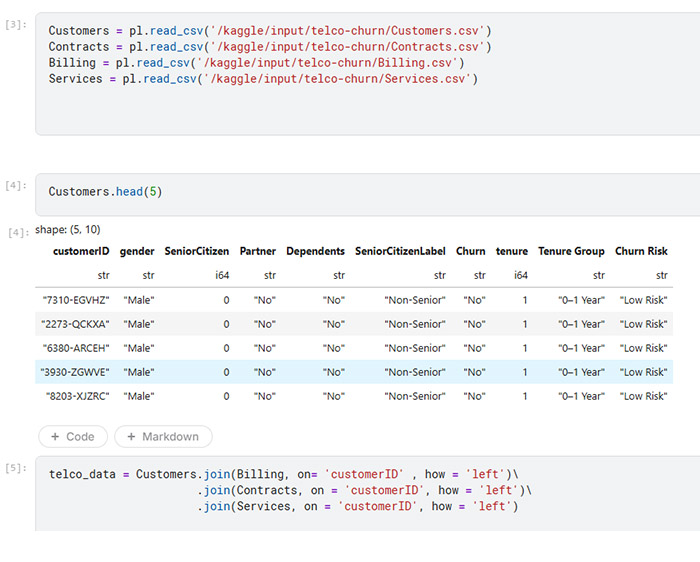
NB/ The data was originally split across four tables in Power BI: Contracts, Billing, Services, and Customers. After exporting the data to Kaggle, I joined the tables using the Customers table as the primary key to create a single consolidated dataset.
Tools
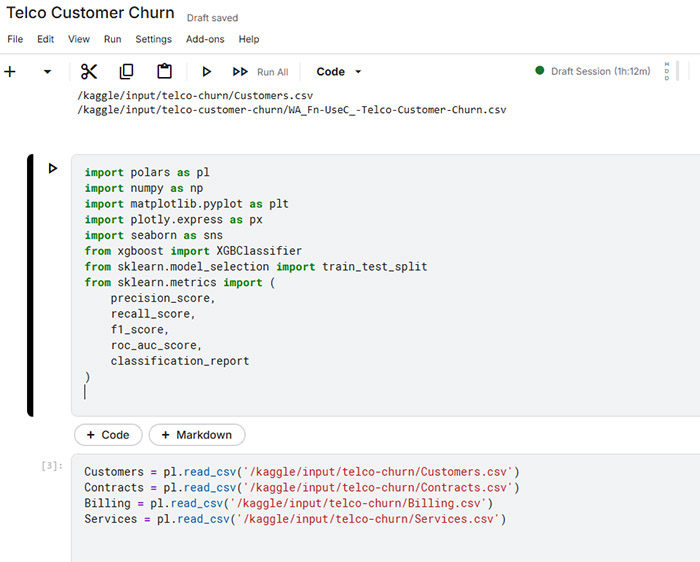
Data Processing & Feature Engineering: Polars
I used polars for data processing and feature engineering due to its high performance and efficient memory usage.
Modeling: XGBoost (XGBClassifier)
XGBoost as the modeling algorithm because of its strong performance on structured (tabular) data and its ability to capture complex, non-linear relationships.
Evaluation: Precision, Recall, F1-Score, ROC-AUC
Explainability: SHAP (SHapley Additive Explanations)
SHAP to interpret the model’s predictions by quantifying the contribution of each feature to individual predictions and overall model behavior.
Environment: Kaggle / Python
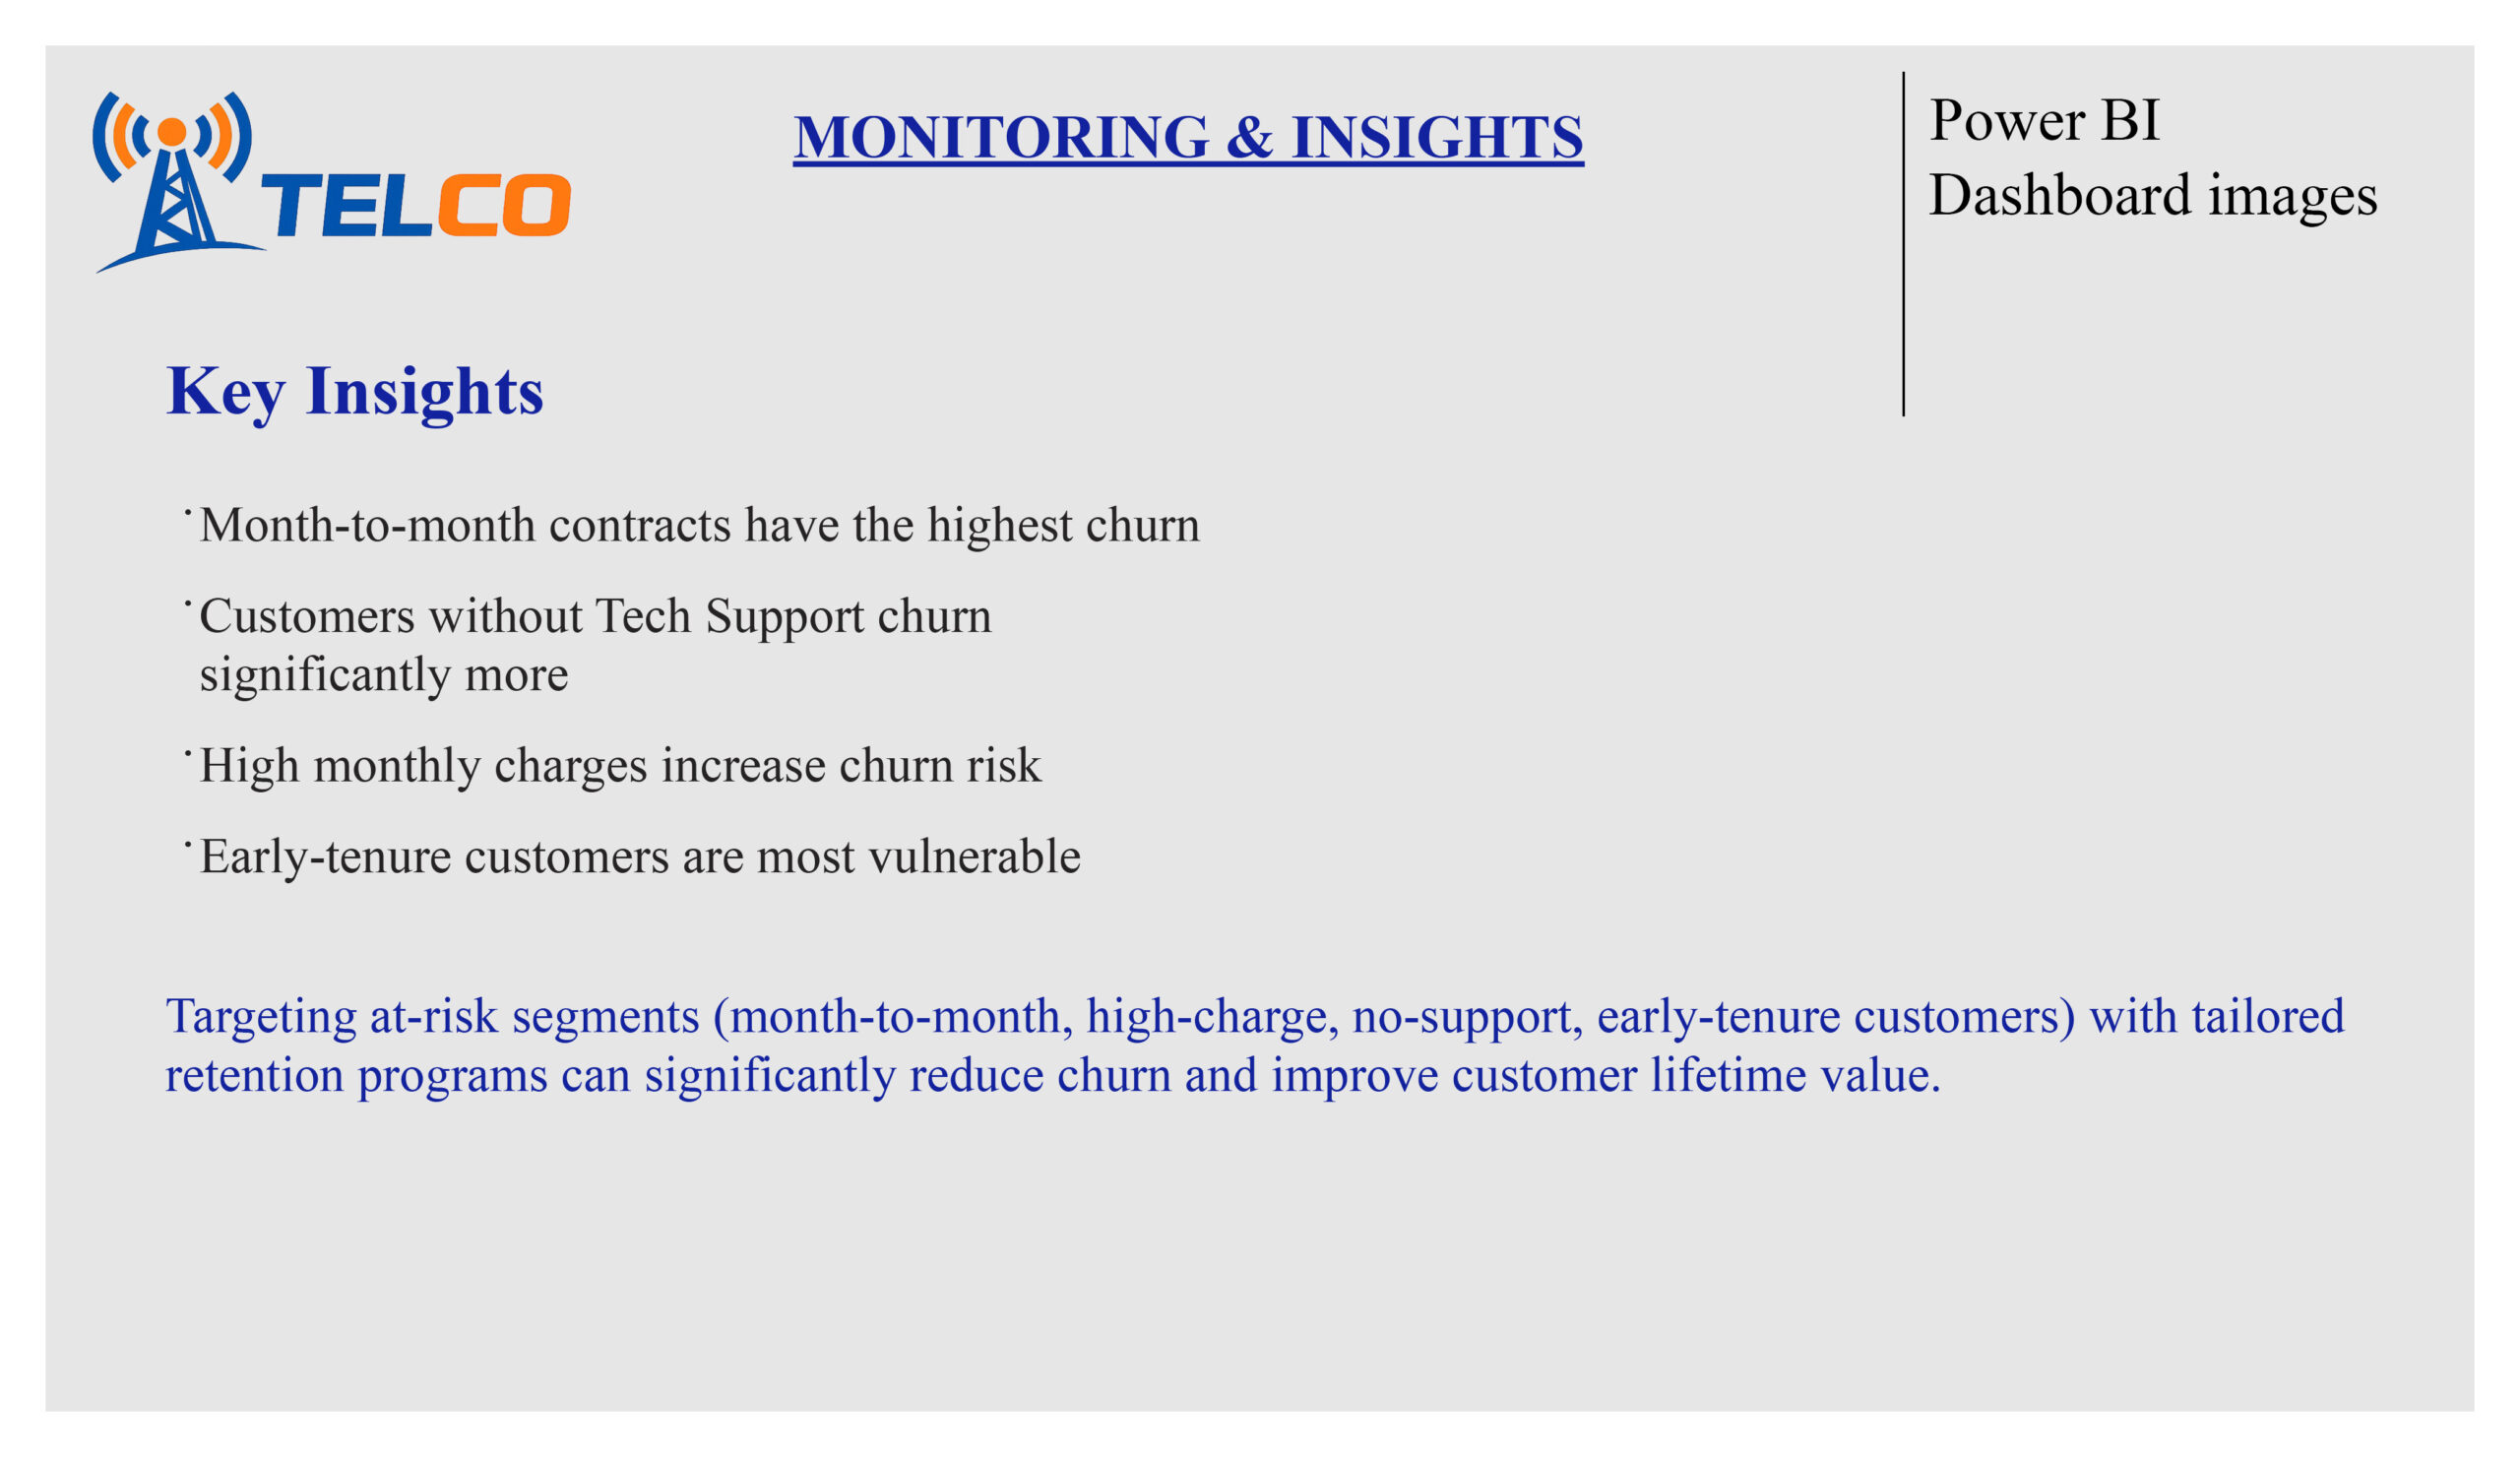
Exploratory analysis revealed clear churn patterns:
i) Month‑to‑month contracts show the highest churn
ii) Customers without Tech Support churn significantly more
iii) High Monthly Charges increase churn risk
iv) Early‑tenure customers are the most vulnerable
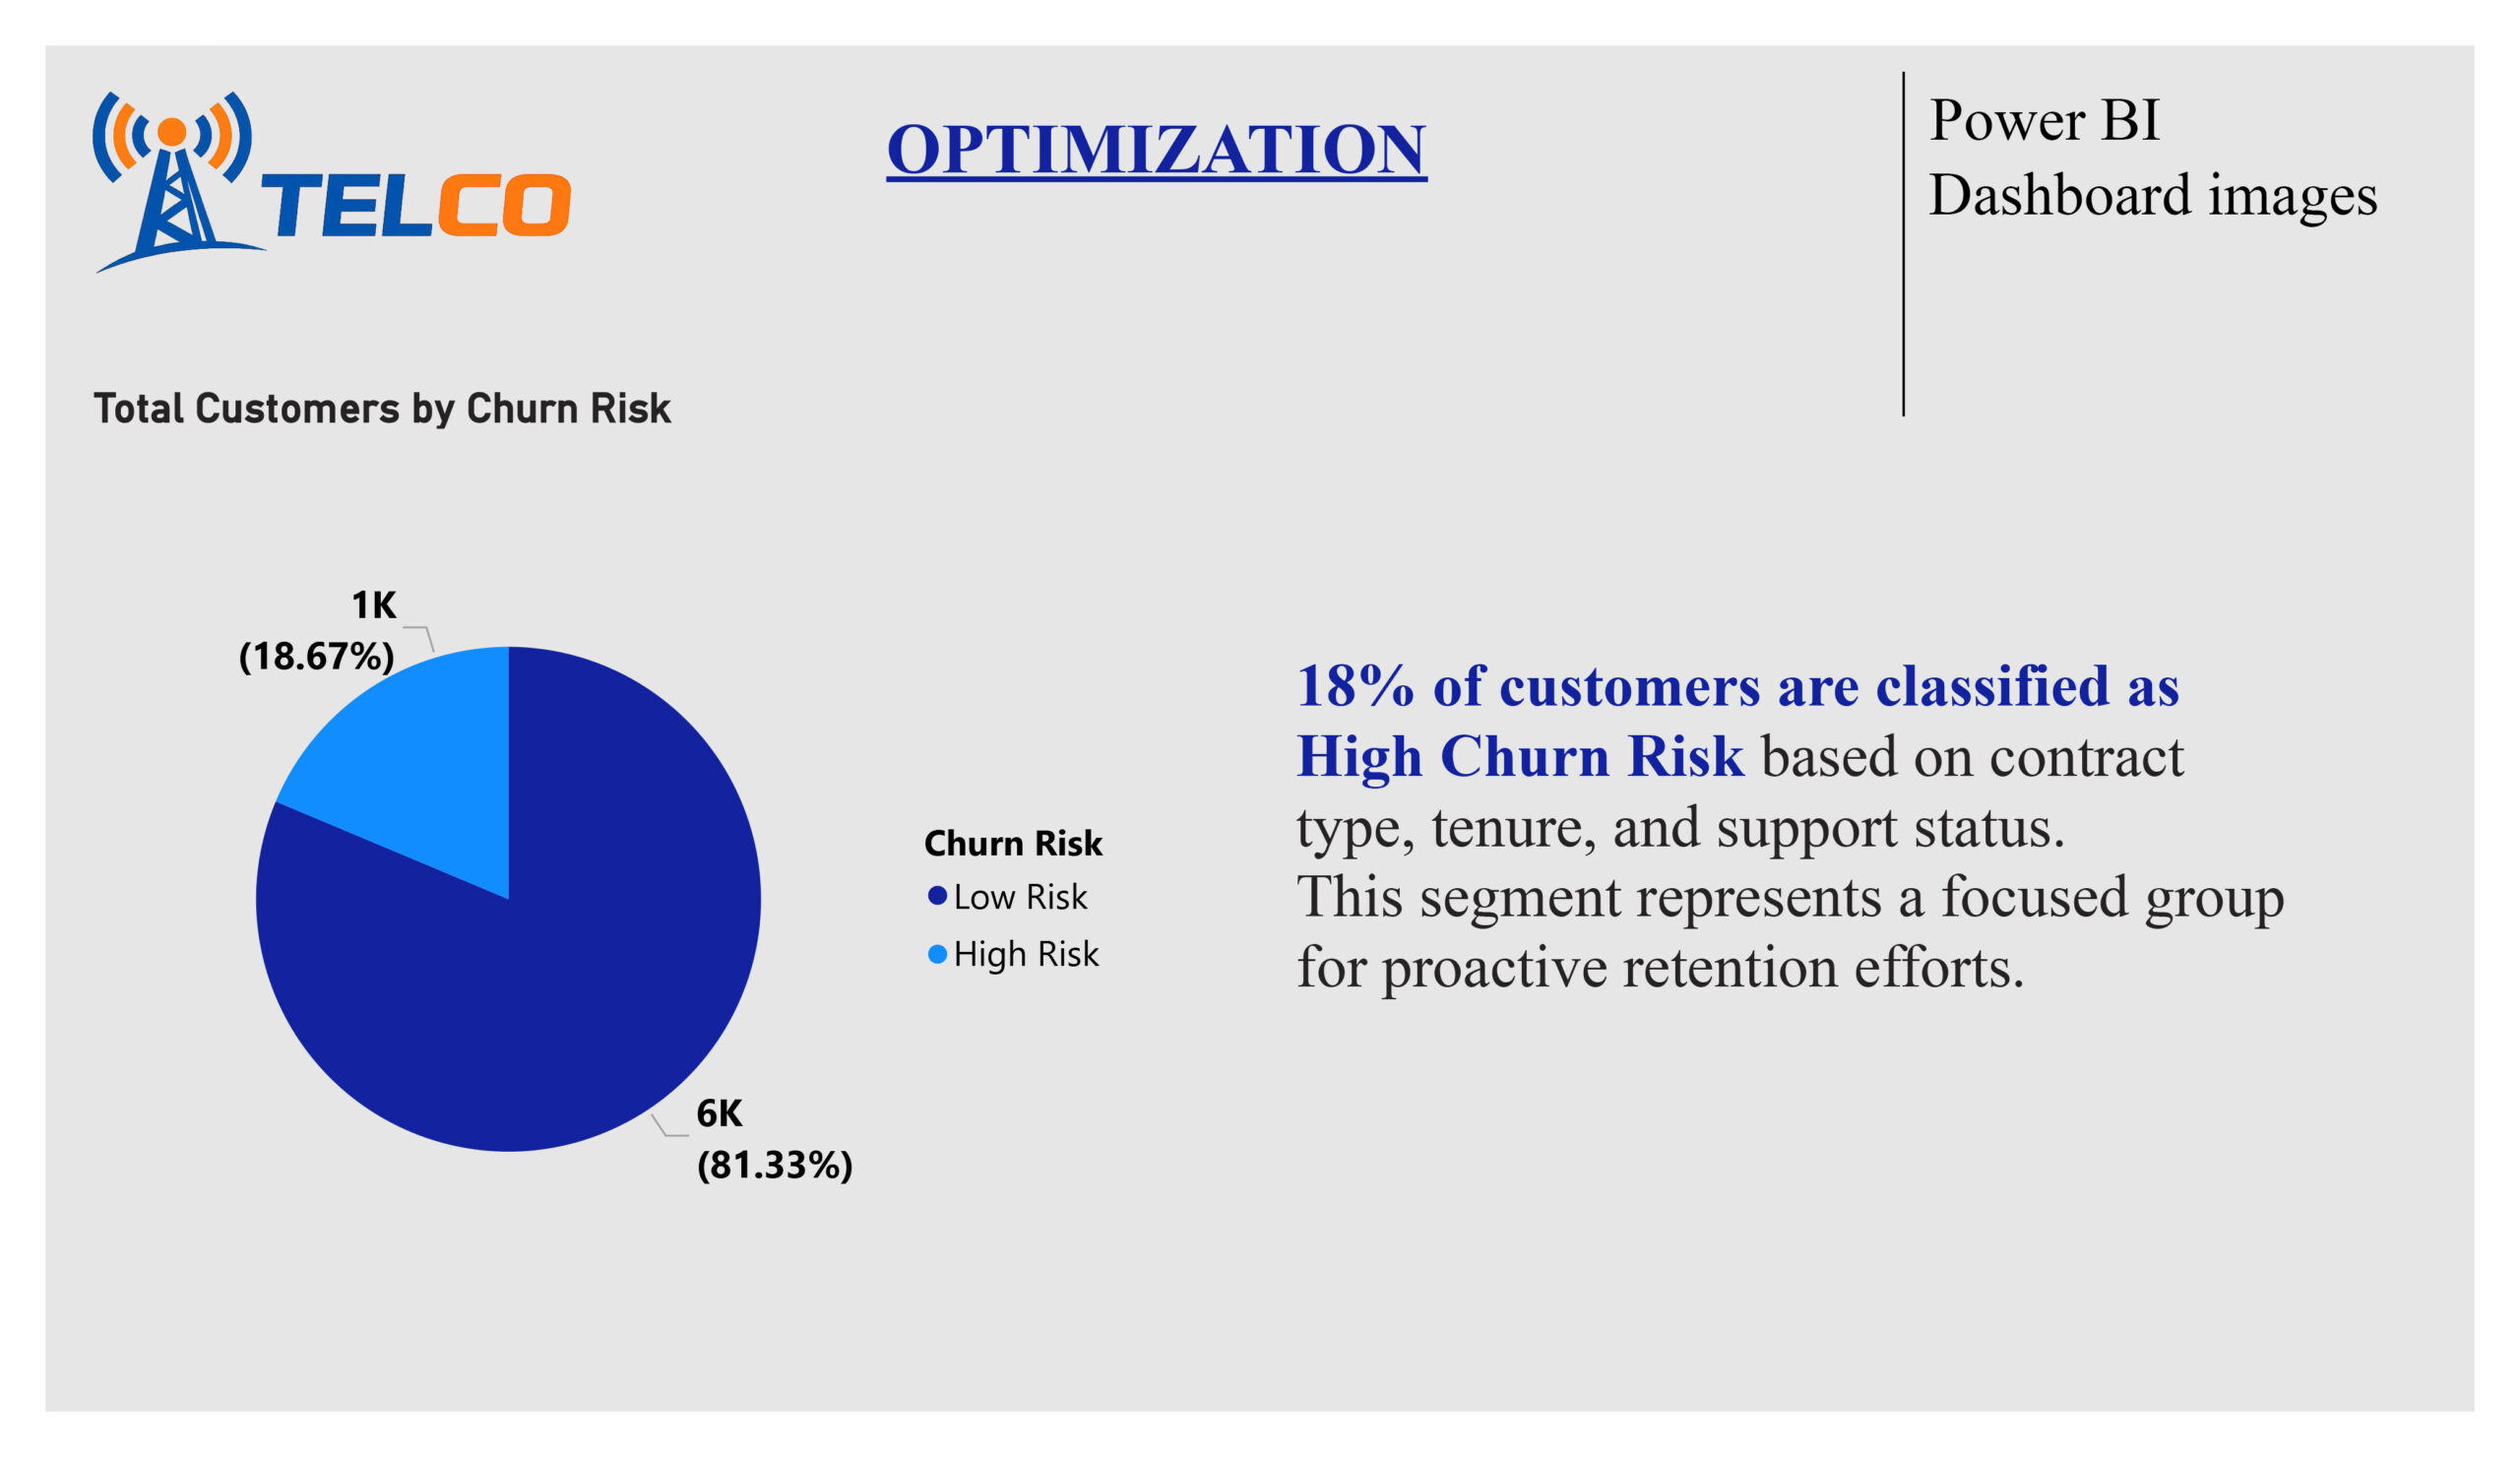
v) 18% of customers form a high‑risk churn segment
These insights directly guided feature selection and model design.
Feature Engineering & Encoding
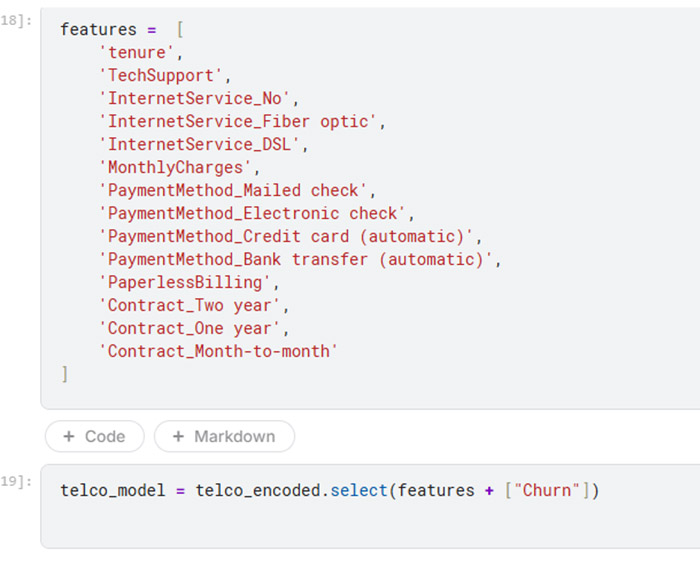
Selected Features (Business‑Driven)
- Contract type
- Tenure
- Monthly charges
- Tech support availability
- Internet service type
- Payment method
- Paperless billing
Engineering Steps
Currency fields cleaned and converted to numeric
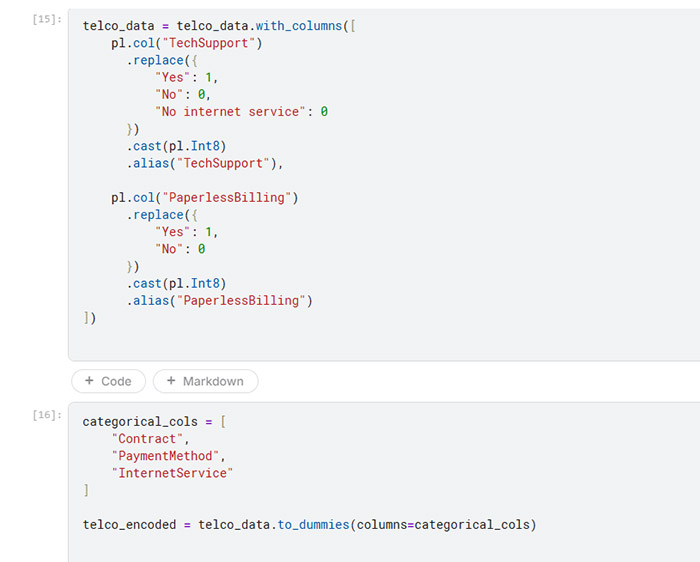
Binary encoding for service indicators (e.g., TechSupport)
One‑hot encoding for categorical variables
Low‑value or redundant columns removed
NB/ Feature engineering was domain‑informed, not automated blindly.
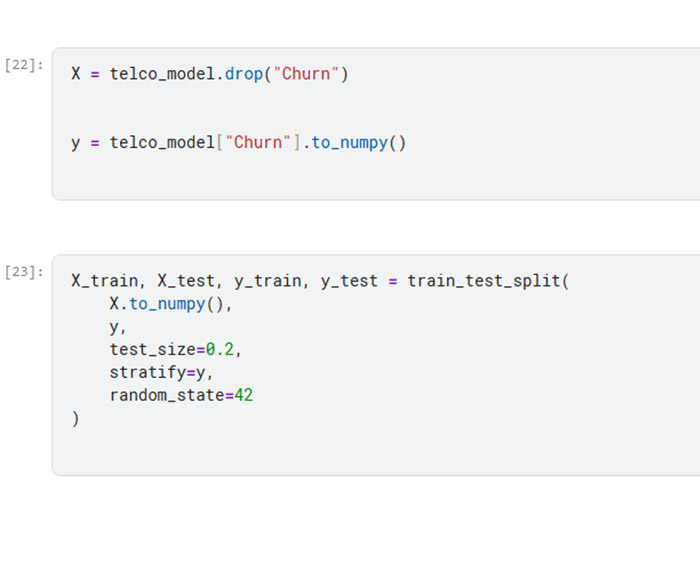
Holdout strategy
I used a holdout train–test strategy with a stratified 80/20 split to preserve the original churn distribution across both datasets. All preprocessing steps were performed in a leakage-safe manner, ensuring that information from the test set was not used during training. This approach provides a realistic estimate of model performance and better reflects how the model would behave under real business conditions when making predictions on unseen data.
XGBClassifier
I used XGBClassifier, an implementation of XGBoost, because it is a gradient boosting algorithm that builds an ensemble of decision trees sequentially, where each tree learns to correct the errors of the previous ones.
This makes it highly effective for tabular data and classification tasks, like predicting customer churn. It can handle non-linear feature interactions, making it robust in real-world scenarios.
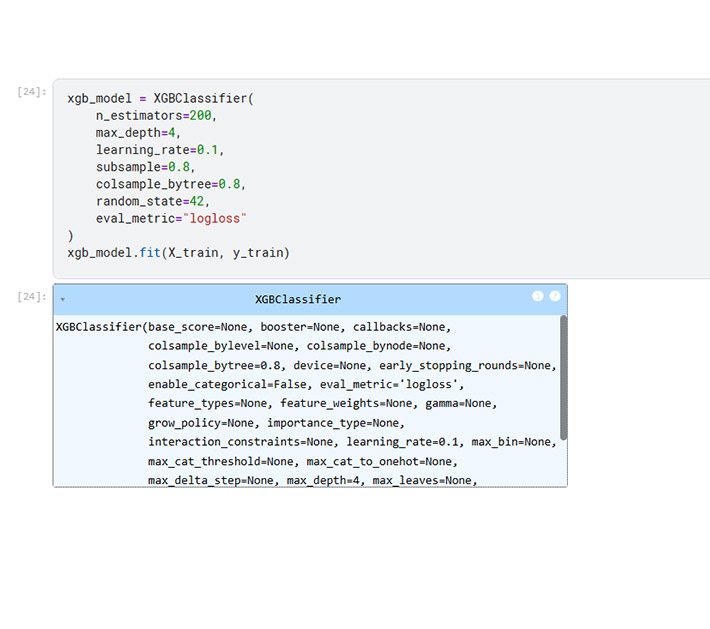
Parameters
n_estimators=200
This sets the number of trees the model will build. More trees allow the model to learn complex patterns but may increase the risk of overfitting. I chose 200 as a balance between learning capacity and training efficiency.
max_depth=4
This limits how deep each tree can grow. Shallower trees (like depth 4) help prevent overfitting and keep the model generalizable while still capturing meaningful patterns.
learning_rate=0.1
This controls how much each tree contributes to the final prediction. A smaller learning rate makes training slower but can improve accuracy and stability because the model updates gradually.
subsample=0.8
This randomly selects 80% of the training data for each tree. It introduces randomness, reducing overfitting and improving the model’s ability to generalize.
colsample_bytree=0.8
This randomly selects 80% of the features for each tree, which reduces correlation between trees and further helps prevent overfitting.
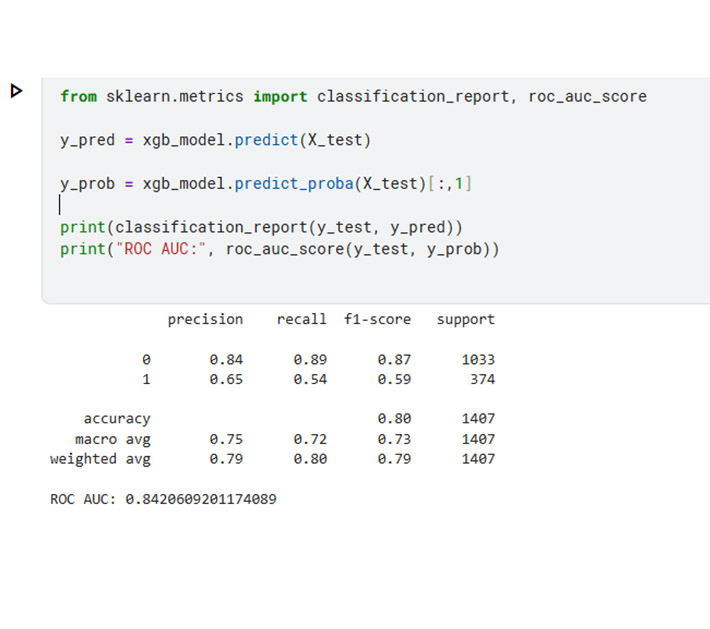
Model Outcomes
The initial XGBoost classifier achieved 80% overall accuracy and an ROC-AUC of 0.84. While the model demonstrated strong overall ranking ability, it only identified 54% of churners, meaning nearly half of the at-risk customers would have been missed. From a business perspective, this level of capture was insufficient for designing effective retention campaigns, as many high-risk customers would remain unaddressed. Feature importance analysis highlighted Contract Type, Tech Support, Monthly Charges, and Tenure as key drivers, aligning with prior BI insights and confirming the model’s interpretability. Although the model performed reasonably well overall, it did not fully meet the objective of proactively identifying high-risk customers for targeted retention.
Model Tuning
To better align with the business goal of identifying high-risk churners, I adjusted the classification threshold to increase the model’s recall. This tuning improved recall to 0.72, meaning the model now captures a larger portion of at-risk customers, while maintaining a similar ROC-AUC (~0.84), confirming that it still ranks customers accurately by risk. Precision remains at 0.57, indicating that slightly over half of the targeted customers are actual churners. In this context, recall is prioritized, because the cost of missing a potential churner is higher than occasionally targeting a low-risk customer. This balanced approach ensures that retention campaigns are both actionable and efficient, maximizing the impact of the available budget while identifying more high-risk customers for proactive intervention.
Model Explainability with SHAP
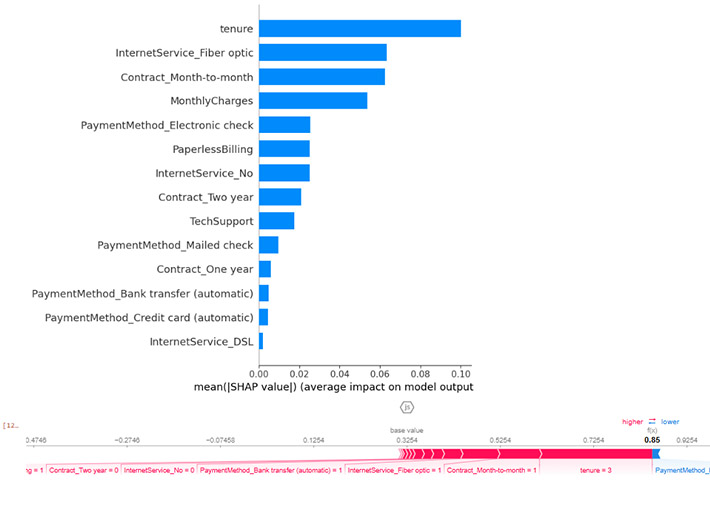
Using SHAP (SHapley Additive Explanations), I analyzed both global and individual-level feature contributions to customer churn predictions. Globally, tenure, contract type, internet service, monthly charges, and tech support emerged as the strongest drivers of churn, confirming prior business intelligence findings. Short-tenure customers, month-to-month contracts, fiber-optic internet, and higher charges increase churn risk, while longer contracts and tech support reduce it. This alignment demonstrates that the model is learning real, actionable patterns, not noise, and provides stakeholders with clear insights into which customer segments are most vulnerable.
At the individual level, SHAP force plots allow retention teams to understand why specific customers are predicted to churn. For example, a customer may be flagged as high-risk due to a combination of short tenure, month-to-month contract, and high monthly charges, even if some stabilizing factors exist. These insights support targeted retention strategies, such as contract upgrades, tech support bundles, or onboarding incentives. By linking predictive analytics directly to business actions, this work illustrates how data-driven modeling can deliver measurable impact and guide growth-focused decisions.
Through this project, I demonstrated the ability to combine data exploration, feature engineering, and advanced modeling to deliver actionable business insights. By prioritizing high-risk customer identification and aligning model decisions with retention strategy goals, I translated complex analytics into practical, revenue-impacting recommendations. I thrive at the intersection of data science and business strategy, turning predictive models into measurable outcomes that drive growth and operational efficiency.
Data exists at multiple levels, and understanding it is key to unlocking business value. From monitoring operations to generating insights, enabling optimization, driving monetization, and ultimately achieving transformation, the way data is leveraged depends on your business goals. By aligning analytics and modeling with strategic objectives, data can guide decision-making, improve efficiency, uncover growth opportunities, and drive measurable outcomes.